 Schedule a demo of LiquidPlanner with a product expert today
« See All Training Videos The Resource Workload report on the People tab shows what teams or individual people are working on, when they’re
LP CLASSIC Support
(Pre-Spring 2021)
If you are using the CLASSIC version of LiquidPlanner and need help or professional service, please Contact Us.
Search Results For: report
Your LiquidPlanner workspace holds a rich store of project data. From the Analytics tab, you’ll be able to create custom reports with this data to gain
Baseline analytics reports allow you to see how a project truly unfolds from project initiation to project completion. In LiquidPlanner, baseline analytics reports compare
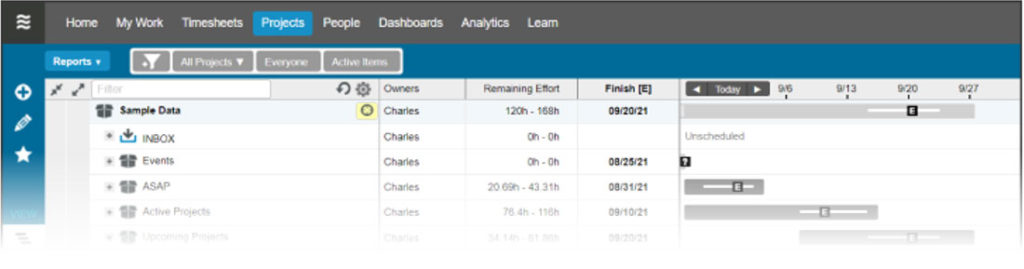
LiquidPlanner’s predefined reports are located in the Reports Menu on the Projects tab. Click Status to view the Status Report for a selected plan item.
The Personal Status Report will show you all of the tasks you own that have either hours logged or hours remaining during the selected date range.
The Project Workload report on the Projects tab allows you to visualize team utilization and workload distribution within a project or group of projects.
The Remaining Trend report (a.k.a. Burndown Chart) shows the estimated remaining work over time, plus a projection to the probable landing zone. Use the
The Total Trend report plots the total work (remaining effort plus logged progress) over time, so you can see the work expanding and contracting
The Date Drift report (a.k.a. the Slip Report) plots the expected finish date for a plan item over time. For a project, it shows you