 Schedule a demo of LiquidPlanner with a product expert today
The best tool for analyzing your team’s time-tracking data is Microsoft Excel; this article describes two methods using Excel.
Make sure you’re familiar with timesheets and know about clients, projects, and activities before proceeding with the steps in this article.
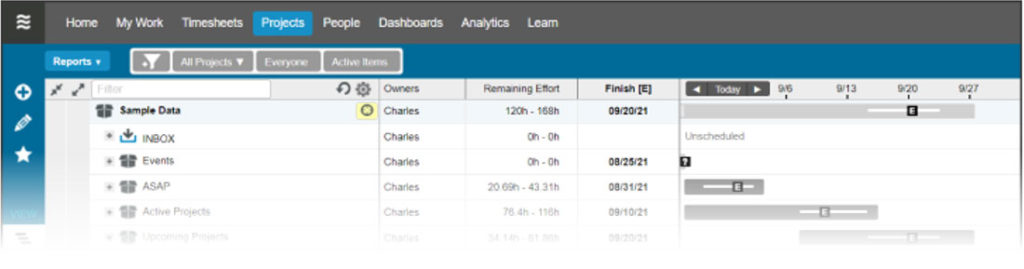
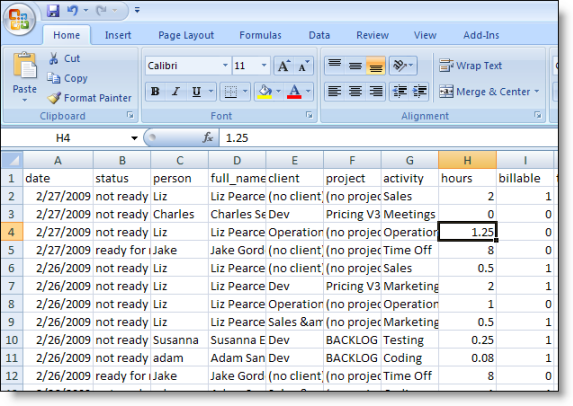
To export the data to a file, go to the Timesheets tab > Export Timesheets. Use the filters to select your data and then run the export. You’ll get a file that looks like this in Excel:
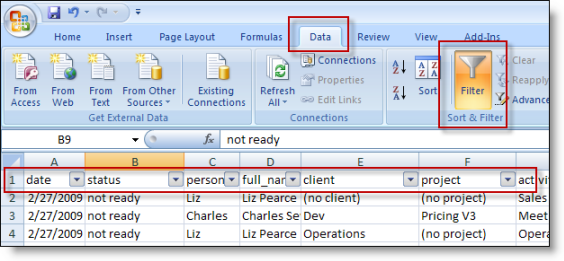
Method 1: Auto-Filter Columns
In this method, select the first row of your data, click Excel’s Data tab, and then click Filter.
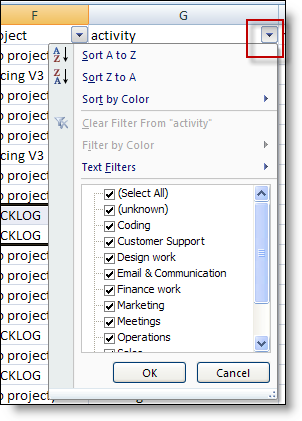
Click on the down arrow buttons on the column headers to slice and dice your data set:
Method 2: Pivot Tables
Pivot tables are awesome because they can categorize and total up categories (and more); but they are a bit trickier.
In this method, select columns A-L, then click Excel’s Insert tab, and then click PivotTable.
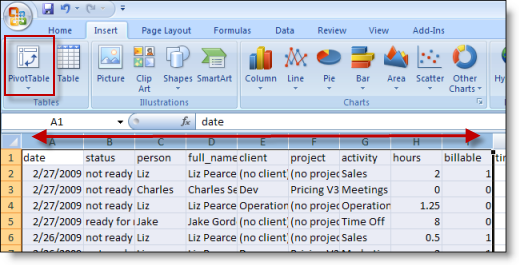
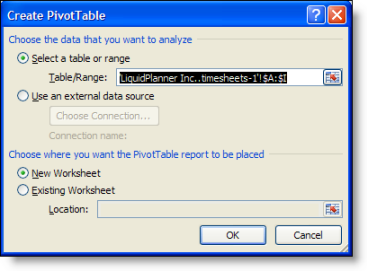
You’ll get a confirmation dialog; just use the default options:
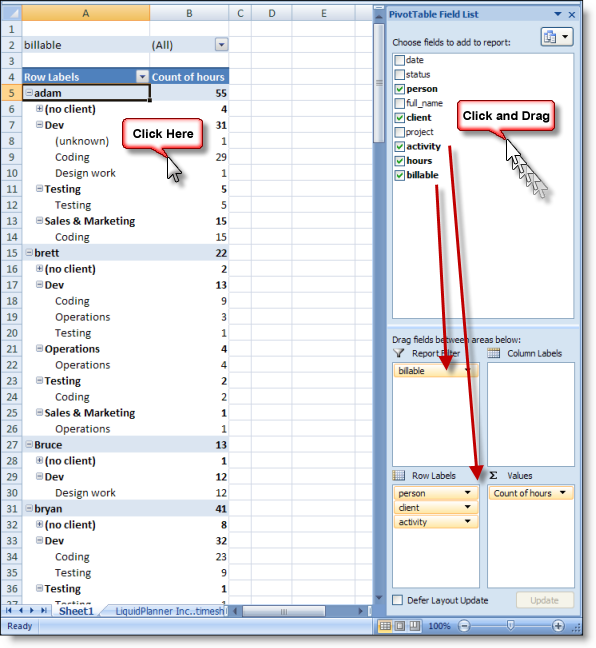
The new pivot table will be on a new sheet and it will be empty at first. You have to click on it to make it come to life. Once selected, the control pane will open up and you can start dragging data fields to the four boxes on the bottom part of the pane; this makes the table do stuff.
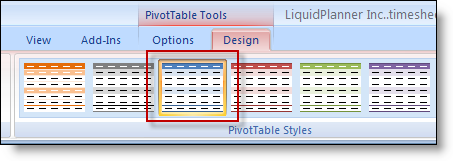
When the table is selected, there are extra tools available like the pre-formatted table color choices on the design tab:
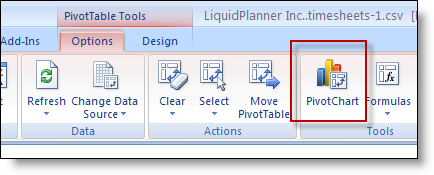
The options tab has the goodies for making pivot charts; the best way to learn this is to play around with it.
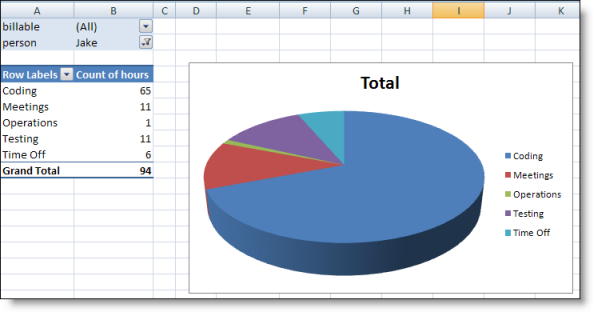
Note how the filters are used in the upper left of this table above. There are a ton of ways to group and organize information in a pivot table.
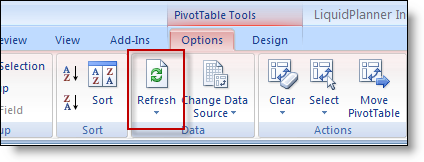
One trick with the pivot table is that if you change the source data on the original sheet; you’ll need to refresh the pivot table. To do this, click on the pivot table and use the option tab:
Microsoft Excel’s Pivot Table provides a great ability to slice and dice timesheet data. To learn more, go to the help system embedded within your Excel application and search for “Pivot Table” and then “Pivot Chart”.