Schedule a demo of LiquidPlanner with a product expert today
Dashboards consist of building blocks called widgets. You can choose from ten different types of widgets and add up to twenty widgets to each dashboard.
Add a Widget
To add a widget, click + Add Widget, select the widget type and configure your widget.
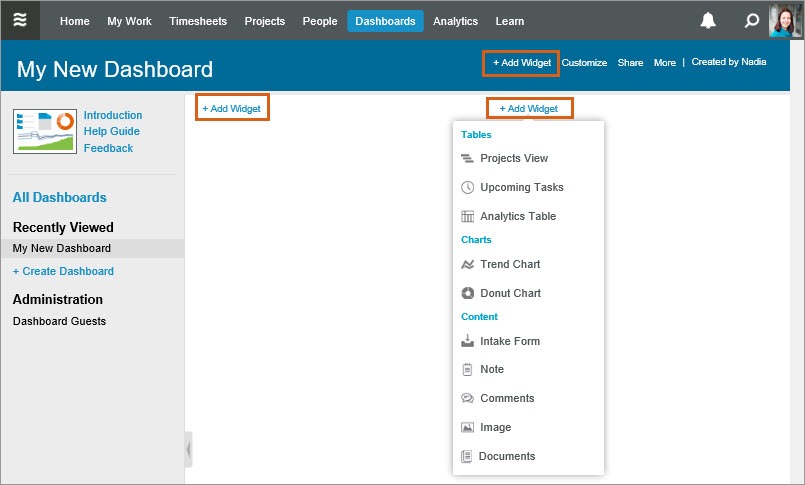
The widget descriptions below will teach you about each type and help you decide which widgets will work best in your dashboards to effectively communicate your plan data and related information.
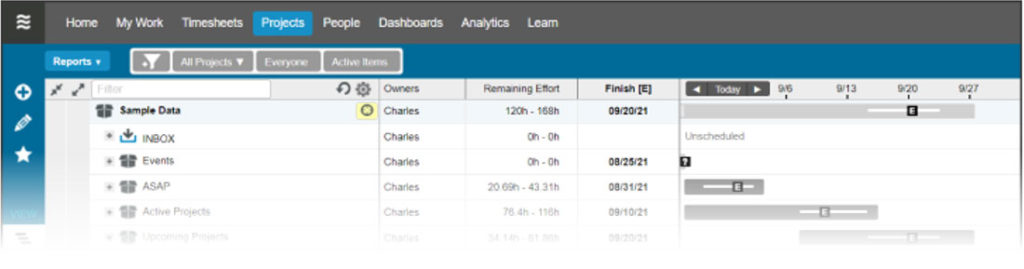
Projects View Widget
Use this widget to show a specific part of the plan exactly as it is seen on the Projects tab. You can choose to display the schedule bars and expose columns to show more details. Viewers can hover over the schedule bars to get basic information, like finish dates and deadlines.
Suggested uses:
- Show a high level overview of your project portfolio to your Executive team.
- Display the schedule for project phases and milestones to the project team.
- Show your customers the active work in their projects in the priority order.
Configuration tips:
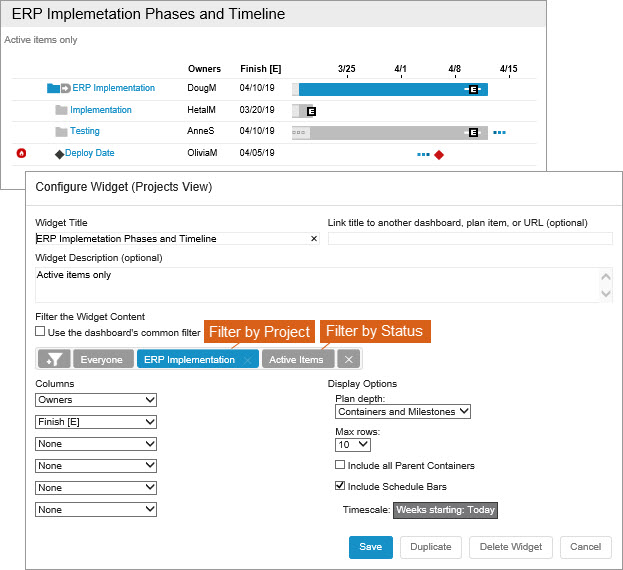
- Filter to a container and set other filters as desired. In the configuration window above, notice that the widget is filtered to display metrics from Active Items in the ERP Implementation project.
- The Plan Depth determines the level of detail displayed and in this example, it is set to show only “Containers and Milestones” within the filter parameters. For a more detailed view of all items within the project, choose “Full Plan” or, to display only one level expanded beyond the filter results, choose “Top Level”.
- Use the Timescale picker to choose the schedule bar anchor date and set the timeline scale to days, weeks, months, or quarters.
- Mouse over the column headers and drag left or right to resize the column width.
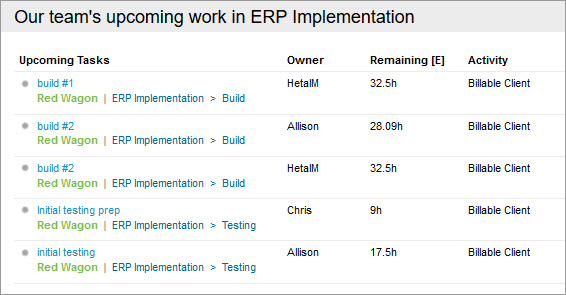
Upcoming Tasks Widget
This widget displays upcoming work in start date order for selected people or teams, similarly to My Work Tab.
Suggested uses:
- Check what’s on your team’s plate on the Team Dashboard.
- Keep track of your upcoming tasks and events on your personal dashboard.
- Use it on a Project Dashboard to see what’s coming up next during your project team meeting.
Configuration tips:
- Filter to a specific location or client to narrow down the scope.
- Filter it to persons or teams whose tasks and events you want to display.
- If there are multiple owners on an item, each person’s assignment will appear as a separate row.
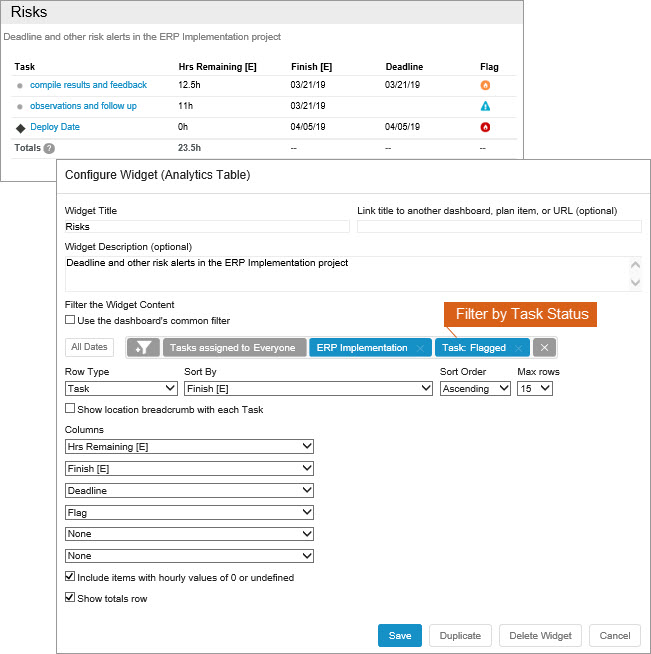
Analytics Table Widget
This widget pulls real-time project data for the selected columns, similarly to the reports on the Analytics tab.
Suggested uses:
- Use the Analytics table widget to show the key project metrics, such as hours logged and remaining, status, deadline, expected finish dates, and more, for your executives, project teams or clients.
- This type of widget works great to report on your resources’ workload and availability in any date period. Use a separate Analytics Table for the Out of Office Events.
- See all projects or tasks with a certain status in one place – for example, those with scope, schedule, or budget risk. Go to What is Putting My Projects At Risk article for specific examples.
Configuration tips:
- Filter the data and select Row Type and Column options. In the example below, the widget named “Risks” is filtered to the same ERP Implementation project, the Row Type is set to “Task” and the Task Status filter is set to “Flagged” to include the tasks with alerts. You’ll also notice that “Flag” is displayed as a column in the table for a quick visualization of the alert type and severity.
- By default, the tasks are sorted by their Priority placement on the Projects tab. You can change the Sort By order to Finish [E], Deadline, or any other metric.
- The data displayed in an analytics table widget is based on hours. This means that the table will include metrics from items with Hours Logged or Hours Remaining [E] in the selected date range that fit your filter parameters. In the example below, the date range is set to “All Dates”. To include items that do not have any logged or remaining hours associated with them, such as milestones, check the box at the very bottom of the window to “Include items with hourly values of 0 or undefined.”
- Mouse over the column headers and drag left or right to resize the column width.
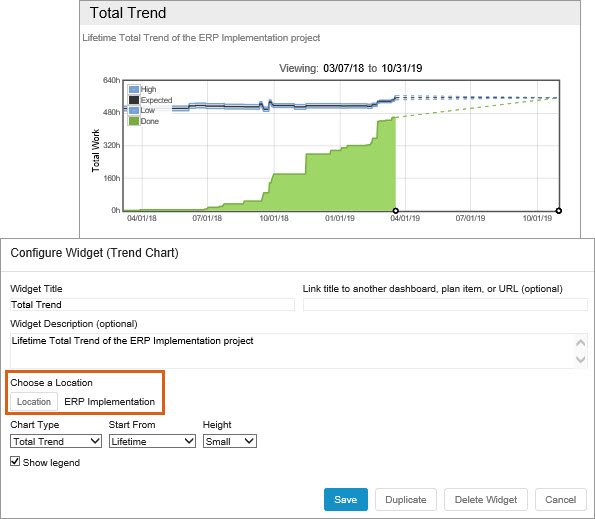
Trend Chart Widget
Trend Chart allows you to see changes in estimates, effort, and/or dates over time for a set of work, like a project, a sprint, or initiative.
Suggested uses:
- In a Project Dashboard, use the Total Trend and Date Drift trend charts to visualize the uncertainty and see how it decreases over the lifetime of your project.
- Project Managers use this widget to see if their projects are trending in the right direction or exhibit signs of scope creep, underestimation, or delay in progress.
Configuration tips:
- In a Trend Chart widget, use the Location picker to choose a specific plan item.
- Use the Chart Type to select from Total Trend, Remaining Work or Date Drift trend charts.
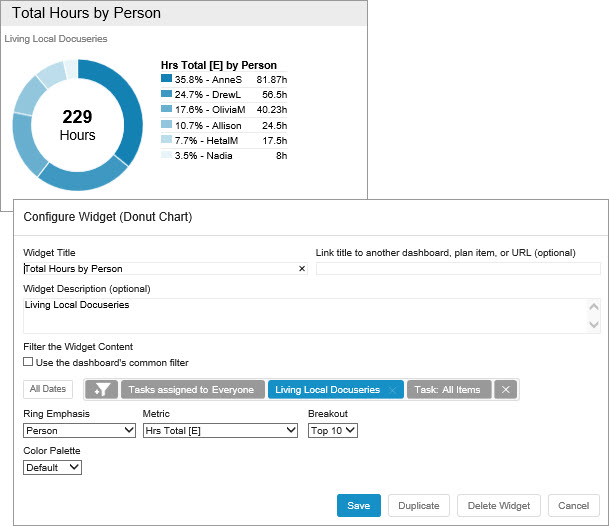
Donut Chart Widget
The Donut Chart Widget allows you to easily visualize the breakdown of hourly metrics as well as task and project counts by project, task, client, custom field, etc.
Suggested uses:
- Visualize your project scope and resource distribution by creating donut widgets with logged hours, remaining hours, or total hours, by person.
- Get a task count by status or type.
- Quickly see how your team’s time is being spent in a Donut chart with logged hours by Activity on your Team Dashboard.
Configuration tips:
- Choose a Ring Emphasis to define the focus and select the Metric.
- Donut Chart color palettes include blue, orange, green, charcoal, and default (uses your custom field picklist color).
- In the widget below, the Ring Emphasis is set to person and the Metric chosen is Hours Total [E] . The widget is also filtered to a specific project and has a Task Status filter set to All Items, which means we’re looking at the total work allocation of each person for the Living Local Docuseries project.
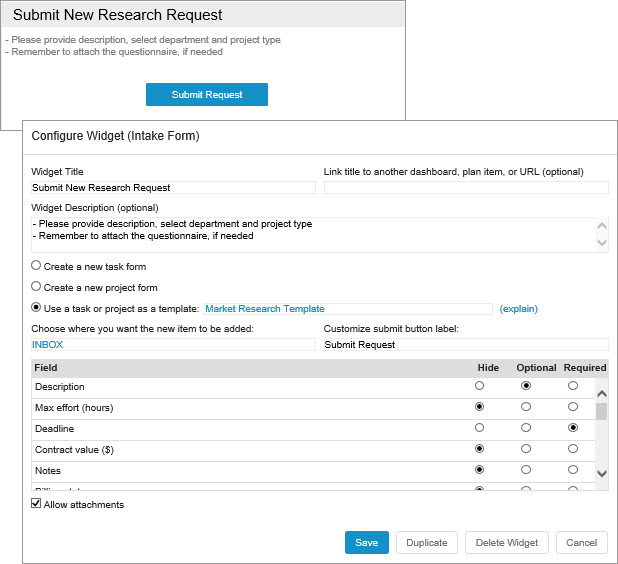
Intake Form Widget
The Intake Form widget is great for building a streamlined intake process for workspace members and dashboard guests to submit new project requests, issues, change requests, client feedback and so on.
Suggested uses:
- Standardize the process your internal or external customers follow to request projects, specifying a separate template for each type of work.
- Create a quick and easy submission form for bugs or IT issues where users are directed to provide urgency, description, and other necessary information.
Configuration tips:
- Choose whether the intake form will create a new project or a task, or specify a template to be used.
- Choose the location where the new item should be added, select optional and required fields, and customize the submit button label.
- Provide helpful instructions in Widget Description.
- See Managing Requests with the Intake Form for more details on creating these types of widgets, examples, and tips.
Note Widget
The Note widget provides a text editor you can use to display formatted messages, insert links, and add free-text tables.
Suggested uses:
- Communicate instructions or explanations for other widgets.
- When referring to the information on a dashboard in team or project meetings, use it to keep your meeting notes.
- Add any useful information that’s not directly related to your plan items, such as your team’s quarterly goals or announcements.
Comments Widget
This widget displays a conversation stream that pull in up to 25 recent comments posted on relevant plan items within the last 48 hours. If no comments are added within that time frame, then the widget displays just the last two comments, regardless of date.
Suggested uses:
- Curate the conversations occurring in the project you manage.
- Keep track of the updates on the tasks you own.
Configuration tips:
- Use the filters to narrow down the scope of conversation to a specific project or initiative.
- Decrease the limit for maximum number of recent comments per item to see just the most recent updates.
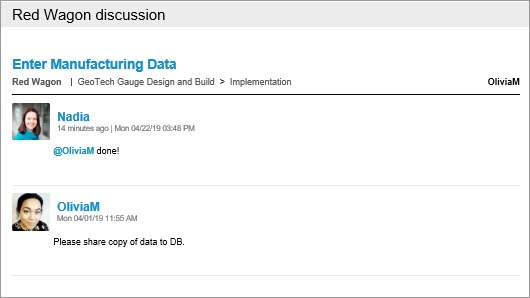
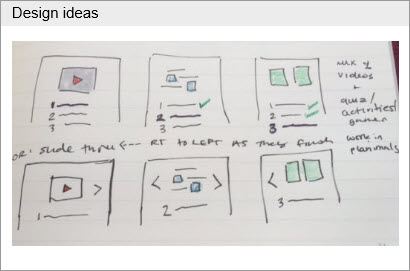
Image Widget
The image widget allows you to upload an image file from your computer.
Suggested uses:
- Provide supporting visuals and add polish to your dashboard. The images chosen for this widget might be logos, designs, sketches, etc.
- Add an inspirational picture to your personal dashboard.
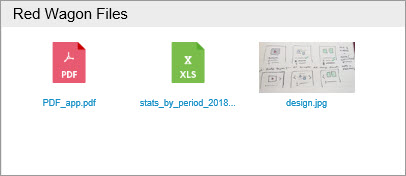
Documents Widget
This widget will display the documents that have been attached to the plan items from your local drive, Google Drive™, Dropbox, or Box and make them accessible for viewers directly from the dashboard. Clicking on an image file will display a larger version. Other files will automatically download.
Suggested uses:
- Make sure all the specs for your project or sprint can be easily found in one place.
- Give your customer access to the relevant forms and paperwork on your externally shared dashboard.
Configuration tips:
- Use filters to narrow down the location of the documents.
- If not all your documents are included in the widget, increase the the maximum number of files to show.