 Schedule a demo of LiquidPlanner with a product expert today
The Baseline View on the Projects tab is best for visualizing how your project plan is keeping pace with earlier projections, exceeding them, or falling behind. It uncovers data about how your project has slipped and exactly which tasks contributed to pushing out the project’s finish date. You’re able to see your project’s original estimated effort and how that compares to the amount of work actually done by comparing the current status of your plan to its status as of a specific date in the past. The insights gained from using this view improve the accuracy of future project planning so you can set your projects and team up for success.
Watch a video about how Baselines can help you understand project performance here: Monitoring Projects
Read about how to run powerful Baseline reports in Analytics here: Baseline Analytics
Access Baseline View
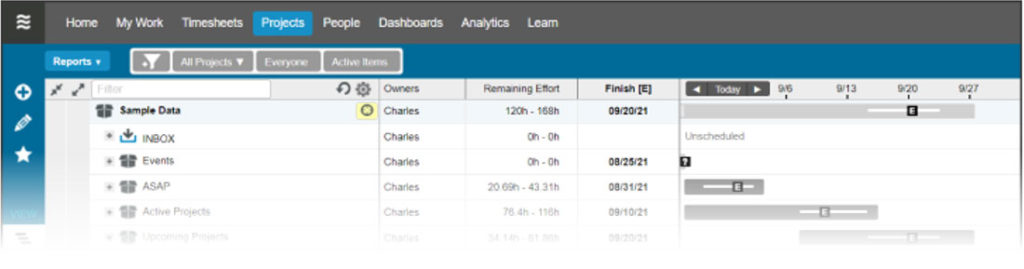
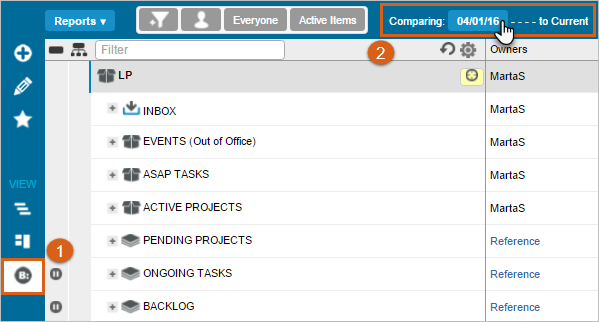
To enter the baseline view, go to the Projects tab and select Baseline View from the left side navigation.
Then, click on the blue baseline date marker in the header row to open the baseline dialog:
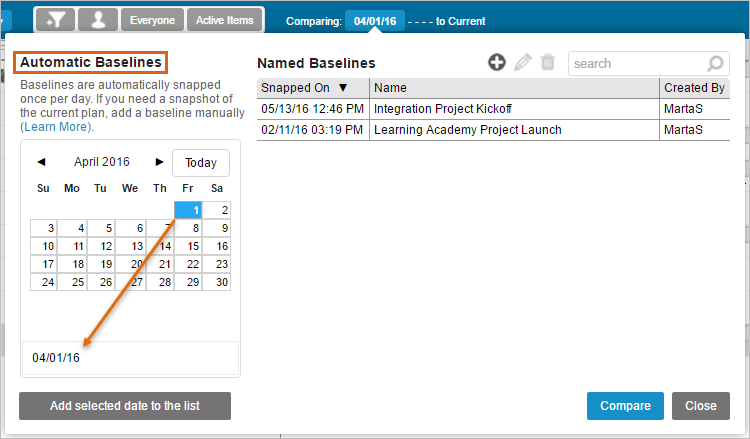
With the baseline dialog open, you have the option to use an automatic baseline or snap a new manual baseline. Let’s take a look at each option:
Use An Automatic Baseline
LiquidPlanner snaps a baseline for you automatically once a day. This means that you’ll always have a comparison point for any day in the past, even if you hadn’t snapped your own baseline manually. To select an automatic baseline:
- Under the Automatic Baselines section, select a date.
- Optional: If this is a date the you’ll use frequently, or if it’s a date that has a special significance that you’d like to label, you can add it to your Named Baseline list by clicking the Add selected date to the list button. Note that the Snapped On stamp for a named automatic baseline includes the date, but no specific time of day.
- Click the blue Compare button to view the baseline comparison.
Snap A Manual Baseline
There might be times when you want to capture your plan in it’s current state – as of this exact moment on the current day. For instance, maybe you just got client approval for the plan at your 9 am meeting, so you want to have a snapshot of exactly what you agreed upon.
This is the key step to getting valuable comparison information out of LiquidPlanner – defining the start of your project by snapping a manual baseline. This means all project work has been added, assigned, estimated, prioritized, reviewed by stakeholders and team members and deadlines have been added.
When you’ve agreed upon the scope and the timeframe for delivering the project, this becomes the benchmark that you want to capture as the true start for the project.
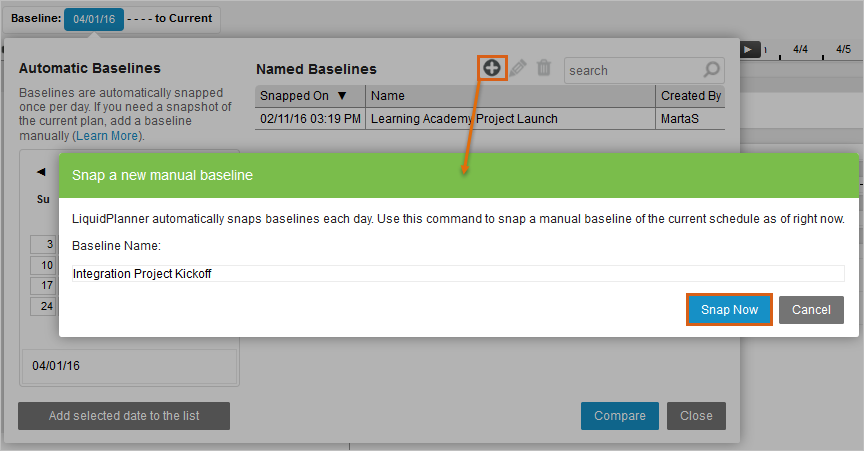
That’s a great time to snap a manual baseline, as follows:
- Click the add/snap a current baseline icon. (The selected date on the left is ignored when you are snapping a manual baseline. You do not have to change that to the current date.)
- Enter a name for your baseline so you can remember why you snapped the project plan status at this exact time.
- Click Snap Now to snap the baseline.
Manually snapped baselines are added to the Named Baseline list for you by default. Note that the Snapped On stamp for a manual baseline includes the specific time of day.
View Baseline Comparisons
Your baseline comparison data is presented in the plan columns and alongside the schedule bars.
Baseline Columns
The following baseline metrics are available to you in the plan columns:
- Remaining Effort – the ranged remaining effort*
- Remaining Effort [E] – the expected remaining effort*
- Total [E] – the expected total effort*
- Max Effort – max number of hours you want to spend*
- Earliest Start – the earliest date that remaining effort could be started
- Start [E] – the date that the remaining effort is expected to start
- Planned Start – if any time has been logged, the Planned Start will reflect the Work Started date. If no time has been logged, it will reflect the expected start (Start E) date.*
- Finish [10%] – the date that you are 10% likely to finish
- Finish [E] – the expected (50% probability) finish
- Finish [90%] – the date that you are 90% likely to finish
- Work Started – the first date that time was logged*
- Logged – the number of hours logged to-date*
- Overall % Complete – the percentage of the total expected effort (Total E) that has been logged*
*Baseline data is not available for these metrics for dates prior to 4/28/2013.
You can expose the columns that you’d like to view via the column picker. When you select one of the columns above, its corresponding baseline column will be automatically shown as well. For example:
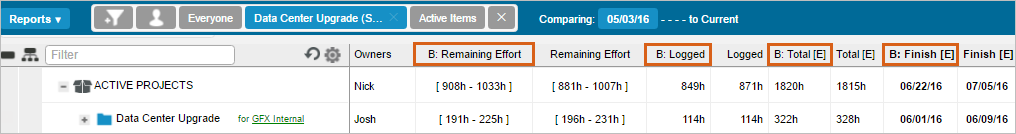
The calculated expected finish date, or Finish [E] takes into account the estimates, logged hours, priority, and availability of your resources, so it’s the single most important indicator of how your project is progressing.
Total [E] is the total expected effort (hours logged + remaining). This calculation works well for understanding changes in scope. On the baseline date, assuming no hours were logged, B: Total [E] represents the original remaining effort for the project. Fast forward to today, and the Total [E] column shows you the current hours logged plus any remaining hours. So, if the current value is higher than the baseline value, you know that the project required more hours than you originally anticipated.
Follow this link for a complete list of columns, their definitions, and how they are calculated: Column Definitions
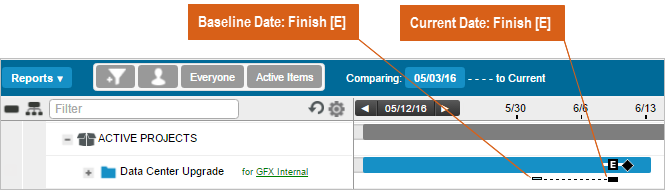
Baseline schedule bars
In the schedule bar area, you will see baseline markers for the Finish[E] date only. The blue marker corresponds to the expected finish as of the baseline date. The longer the dotted line extends, the further the expected finish date of the project has slipped. In this example, we see that our project has slipped – the expected finish is currently further out than it was projected to be as of the baseline date:
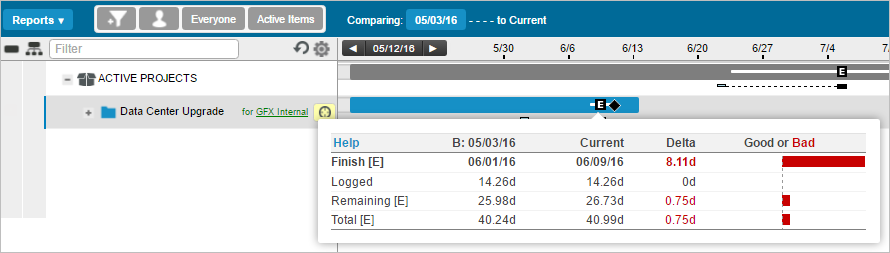
If you click on the schedule bar, you will see more details about key comparison dates, including a Delta calculation. Again, in this example you see that the expected finish for our project has slipped by 8 days:
Non-numeric Baseline Values
Under the following conditions, baseline and delta values will be blank or display a question mark:
- When a baseline metric is not available – prior to 4/28/13 for the starred metrics above.
- When the field was not populated by the user.