 Schedule a demo of LiquidPlanner with a product expert today
Your LiquidPlanner workspace holds a rich store of project data. From the Analytics tab, you’ll be able to create custom reports with this data to gain valuable insights that ultimately help you manage your projects more effectively.
Workspace administrators and managers have access to Analytics. Only workspace administrators can see metrics derived from rate sheet data (billing and pay rules).
Watch a video demonstration here: LiquidPlanner Analytics
Read about baseline reports here: Analytics Baseline Reports
Create a Roll-up Report
The foundation of a roll-up report is hours – hours logged and hours remaining (scheduled). You can use various filters to narrow down the specific set of logged and remaining hours to include in your report.
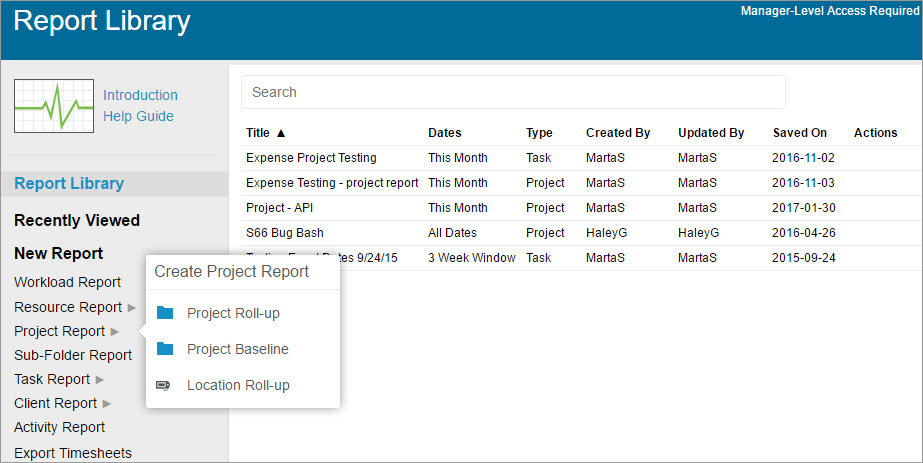
1. Select a report type
- In the New Report menu, click on a report type: Resource, Project, Sub-Folder, Task, Client, or Activity and choose a Roll-up report.
- If you have created Pick List Custom Project and Task Fields in your workspace, you can run a report on these fields from the Project or Task report menus.
2. Select columns
- Click Columns to select the metrics that you’d like to see in your report. Search to find, then drag and drop within the dialog to order the data columns. Note that you can’t remove a column if it is one that LiquidPlanner must reference in order to calculate the value of any exposed column.
- Follow this link for a complete list of columns, their definitions, and how they are calculated: Column Definitions
3. Select a date range
- Your report will include only hours that were logged and hours that are remaining (scheduled) during the selected date range. Hours outside that window will not be accounted for in your report.
- Each report starts out with a default date range which you can change as desired. Choose from pre-defined ranges, create a custom range, or choose All Dates if you do not want any date restrictions on your analysis. When you use any of the “week” filters (This Week, Next Week, Last Week), LiquidPlanner references your workspace Week Start setting in order to determine the appropriate days to include.
4. Filter the data set
- Click the filter icon to limit the data set by various plan dimensions: task owner, project owner, location, package, client, project, tag, custom field, task status, or project status. You can apply multiple filters as necessary. Only items that meet your filter criteria will be included in the analysis.
Including or Excluding Toggle
The Including/Excluding toggle determines whether your data table will show you items that meet your filter criteria but don’t happen to have any Hrs. Logged or Hrs. Remaining during the selected date range. All reports default to the Excluding status, except for the Tasks report, which defaults to the Including status.
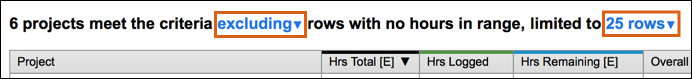
Set the number of rows you’d like to display in your data table with the limited to XX rows drop-down. Note that this is a display control only. All items that meet your filter criteria are included in total metric calculations, even if they are not currently displayed in the table.
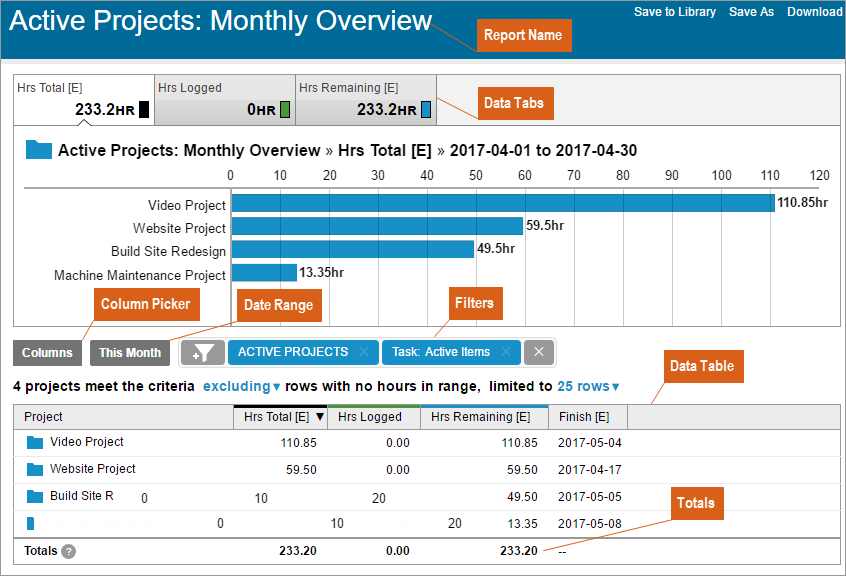
Navigate Your Report
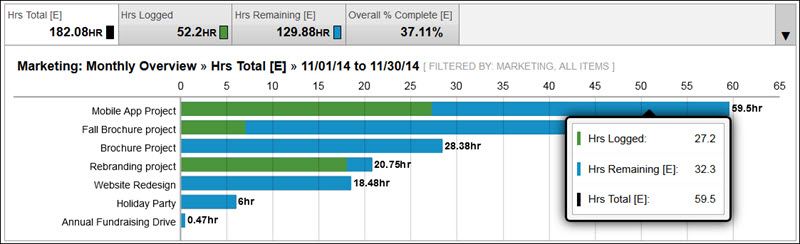
Each graphable metric in the data table has a corresponding tab and graph above it.
The data graph
- The graph shows the first 15 items currently displayed in the data table only.
- Click on either the data tab or its corresponding column header in the data table to see a graph of that metric.
- The value displayed within the data tab is that metric’s total value for all items in your entire data set.
- You’ll notice that for some metrics, the graph lines are tiered. When you see that, click on the graph line to see a breakdown of the individual metrics that make up that total:
The data table
- To sort your items by a specific metric, click the desired column header. Note that sorting can change which items are shown in the graph, since the graph shows only the first 15 rows currently displayed in the data table.
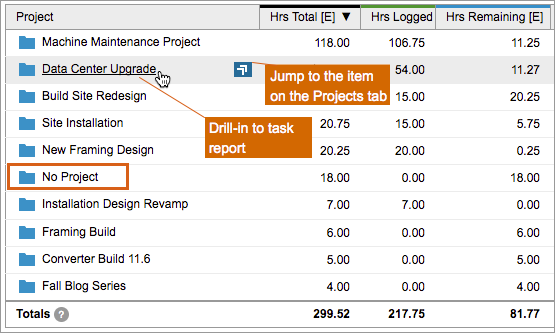
- The Totals row at the bottom of the data table automatically calculates the sum of values from columns with time and financial metrics. All items matching the filter criteria are included when calculating metrics in the Totals row, even if all rows matching the criteria are not currently displayed in the table. Click the “limited to xx rows” dropdown to change the number of rows displayed. Note Overall % Complete is an average of all percentages in that column.
- For most reports, you can drill into an item in the first column of the data table in order to see another level of detail. For example, in a Project report you can click on the project name to see the tasks in that project which are contributing to the metrics in this report.
- When a Sub-Folder report is run, it will show “top-level” sub-folders only. Click on a specific sub-folder to drill down and report on the next level of sub-folders and/or tasks in the project hierarchy.
- Note that you also have the option to jump to a plan item on the Projects tab (task, sub-folder or project).
- Sometimes your data table will include a row that says “No xxx”. For example, a Project report might have a row that says “No Project”. This means that during your selected time frame, there are Hrs Logged or Hrs Remaining on tasks that are not associated to any Project. These hours are included in the total values displayed in the data tabs. Click on that link to drill down to the specific tasks in question.
Save and Download Reports
Saved reports are listed in the Analytics Report Library. Each time you run a saved report, it refreshes to reflect your current plan data. If you’d like to keep a static snapshot of the data from a specific report run, be sure to download the report right after you run it.
To save a report
- Name your report
- Click Save to Library
To download a report
- Click Download
- Choose to download in CSV or PDF format
In both download options, the output will include all data columns that are exposed at the time you do the download. The PDF option will prompt you to select other criteria and will also include the data graph for the one metric that is selected at the time you do the download.
Fetch Reports via the API
Analytics data can be accessed via the LiquidPlanner API so you can build custom integrations between liquidplanner and your other business intelligence tools or reports you’ve built in Excel or Google Sheets. This allows you to sync data, automate actions, and integrate with other systems to connect your LiquidPlanner reporting data to all parts of your business.
Here’s how it works:
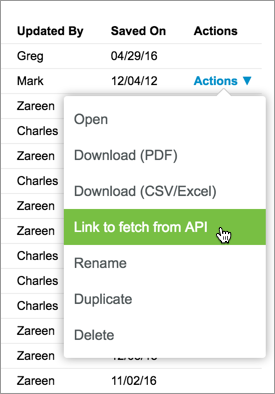
First, create your analytics report, add or remove columns and save the report to your Report Library. Then, go to the Report Library > Actions column of that report > Link to Fetch from API.
From here, you’ll get a link that fetches your reporting data from the API, in JSON format.
With this JSON output, a developer on your end can assist in setting up an integration to pull LiquidPlanner analytics data into another tool you use. To help them accomplish this task, refer your developers to the Developer Hub for API documentation and resources.
A developer will then use the API request to fetch a particular Analytics report to be used as a data source in your other reporting tool. Once this has been initially configured, all you’ll need to do is “refresh” the data in the other tool and all of your real-time project information from LiquidPlanner will automatically be fetched and applied.
Some tools, like Tableau, can even read a JSON file directly. In this case, you can use the data without a developer. Just click Link to fetch from API, open the link in your browser and save the output in .json format. Then, add or import that file into the other tool, following their instructions. Use the data to visualize trends and build reports in the most valuable ways your tool allows. You can even take this a step further and automate this so that changes in the LiquidPlanner data are automatically pulled into your other tool.
Here are a few tips to consider about the JSON data when working with a developer to set up the integration:
- The JSON output will list all the columns available for your report type. The ones that you have exposed in your report will have “displayed” property as “true” in the output. This means the rows of actual data will be fetched only for those columns that are exposed in the report.
- Analytics data will be fetched using the date range set in the report’s date filter. This date range can also be overridden via the API using optional start_date and end_date parameters (instructions in the API Guide) so you can pull the same reporting data for different timeframes without having to create multiple analytics reports in LiquidPlanner.
Here are just a few of the ways you can use the API to build and automate your business reports:
- Time-phased reporting with the ability to pull the same report data from different time periods, you can compare trends over time using the reporting tool of your choice.
- Cross-functional reporting that integrates your LiquidPlanner data with tools used by other teams so you can build holistic reports and analyze data from across the business.
- Automated syncing of real-time LiquidPlanner data with other tools in the business. Teams can refer to this data in another tool whenever they need and know that the information is always up to date.
Assumptions of Analytics Reports
- Events and Milestones are treated the same as tasks.
- Values displayed in Analytics are rounded to two decimal places.
- On-hold items will appear in your reports, but are considered to have no Remaining Hrs.
- Tasks in the Inbox are considered to have no Remaining Hrs.
- When a task has no activity assigned, the hours for that task are assumed to be unbillable hours.
- It is assumed that a task will be completed somewhere between its expected start and expected finish date.
- The Task report applies a built-in, always-on item filter to its rows based on the date range selected. As a result of this special filter, the Task report is the only report where changing the date filter can affect the number of rows in the data table when the Include filter is set. Tasks must match one or more of the following criteria to be considered a match for that date range:
- There is logged work within that date range
- It has a done date within that date range
- Its expected start is within the date range
- Its expected finish is within the date range