 Live webinar: Mastering Project Forecasting in Jira with Portfolio Manager
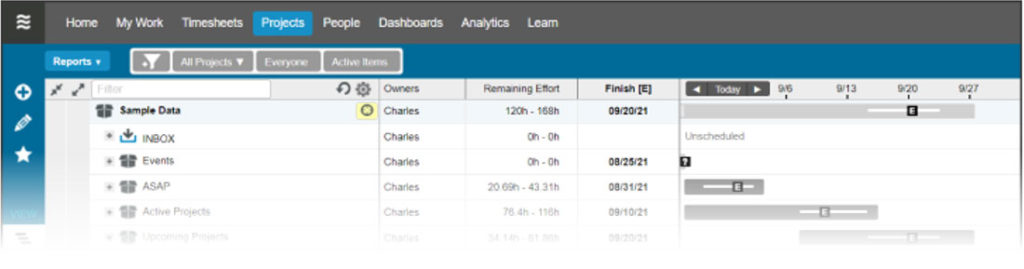
Baseline analytics reports allow you to see how a project truly unfolds from project initiation to project completion. In LiquidPlanner, baseline analytics reports compare your current plan data to how it looked on an earlier date, including delta calculations so you can see exactly what shifted and gain valuable insights into how the original plan compares to what actually happened. They help you understand why your project’s dates changed and identify lessons learned for planning future projects.
Workspace administrators and managers have access to Analytics reports. Baseline reports are available for Projects and Tasks.
Watch a video demonstration of baseline reports here: LiquidPlanner Analytics
Read about the Projects tab baseline view here: Baseline View
Baseline Metrics
LiquidPlanner snaps a baseline for you automatically once a day to capture a static picture of your plan metrics. This means you’ll always have a comparison point for any day in the past. You also have the option to snap a manual baseline at any time to capture your plan at a specific point during the day. These are the metrics for which baseline data is captured:
- Remaining Effort – the ranged remaining effort *
- Remaining Effort [E] – the expected remaining effort *
- Max Effort – max number of hours you want to spend *
- Total [E] – the expected total effort *
- Earliest Start – the earliest date that remaining effort could be started
- Start [E] – the date that the remaining effort is expected to start
- Planned Start – if any time has been logged, the Planned Start will reflect the Work Started date. If no time has been logged, it will reflect the expected start (Start E) date. *
- Finish [10%] – the date that you are 10% likely to finish
- Finish [E] – the expected (50% probability) finish
- Finish [90%] – the date that you are 90% likely to finish
- Work Started – the first date that time was logged *
- Logged – the number of hours logged to-date *
- Overall % Complete – the percentage of the total expected effort (Total E) that has been logged *
* Baseline data is not available for these metrics for dates prior to 4/28/2013
Follow this link for a complete list of analytics columns, their definitions, and how they are calculated: Column Definitions
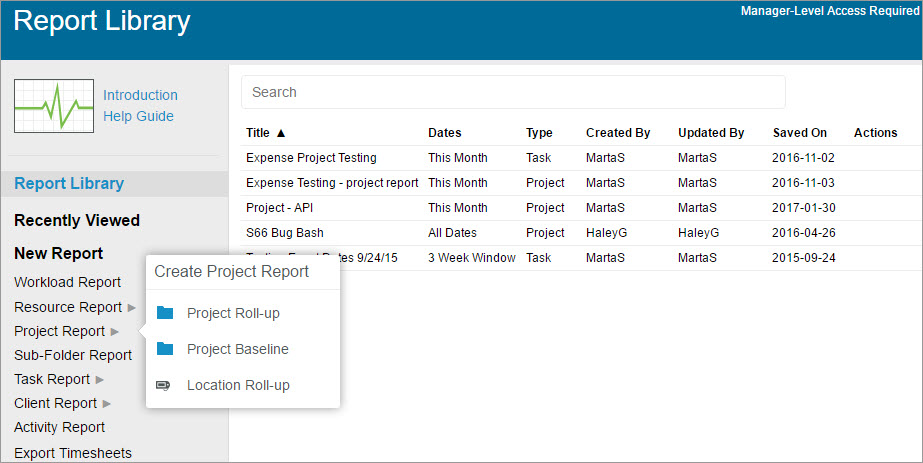
Create a Baseline Report
To get started, click the Analytics tab to see new report options and your Report Library.
1. Select a report type
- In the New Report menu, click on a report type: Project, Task, or Client and choose to run a Baseline report.
2. Select a baseline date
- This is the past date that we’ll use to compare with our current plan data. You can select one of the automatic baselines that LiquidPlanner snaps for you daily, or select a named baseline that you manually snapped on a previous date. In the example below, a manually snapped named baseline is being used for the Blog Series Kickoff date. Read more about selecting and snapping baselines in our Baseline View help article.
3. Select columns
- Click Columns to select the metrics that you’d like to see in your report. You can drag and drop within the picker to order the data columns. Note that you can’t remove a column if it is one that LiquidPlanner must reference in order to calculate the value of any exposed column.
- For each metric that we capture baseline data on, you’ll see three columns in the data table. In the sample report below, this is highlighted for the Hrs Total [E] metric:
- B: Hrs. Total [E] – Baseline total expected hours. What the total expected hours were as of our project kickoff date.
- C: Hrs. Total [E] – Current total expected hours. The number of expected hours as of the current day.
- D: Hrs. Total [E] – Delta total expected hours. The difference between current and baseline.
4. Filter the data set
- Click the filter icon above the data table to limit the data set by various plan dimensions: task owner, project owner, location, package, client, project, tag, or custom field. You can apply multiple filters as necessary. Only items that meet your filter criteria will be included in the analysis. In the example below, we are filtered to include only the Blog Series project.
This report is showing that the Blog Series project is currently 90.57 hours over the amount that was originally estimated at the start of the project:
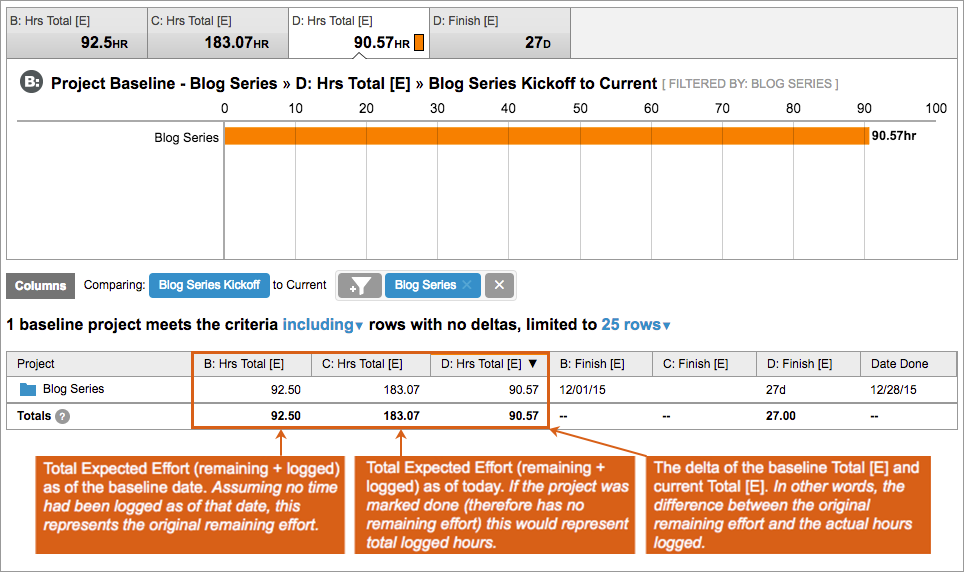
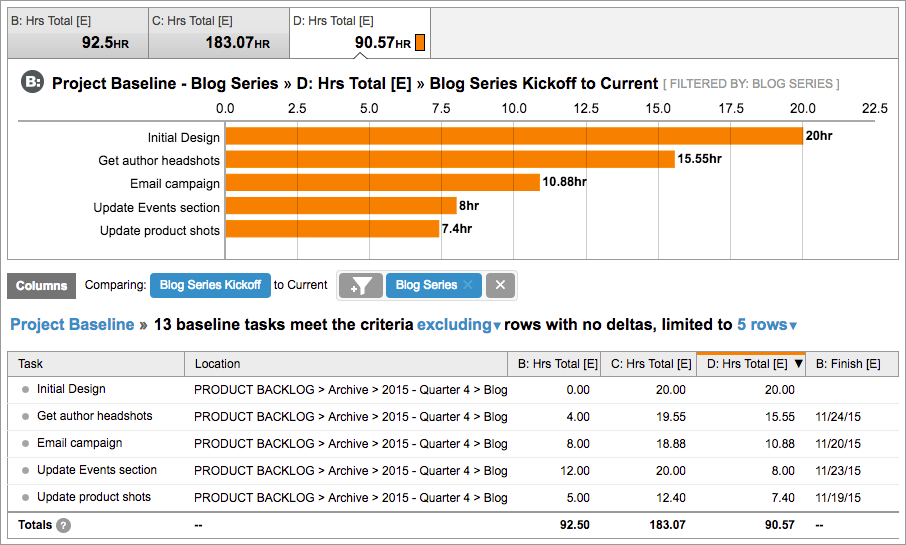
You can drill in further to see which individual tasks had the largest difference between their original estimates and the current amount of effort by clicking the project name in the data table and view a task baseline report:
Including or Excluding Toggle
The Including/Excluding toggle determines whether your data table will show items that meet your filter criteria but don’t have any variance in any of their baseline metrics. Note that baseline reports default to the Excluding status so only tasks with a delta (difference between the baseline and current) will show by default.
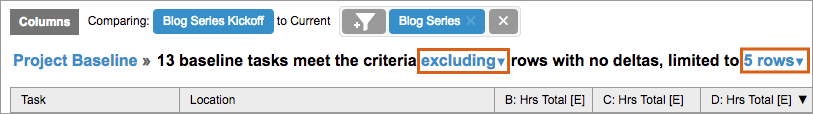
Set the number of rows you’d like to display in your data table with the limited to XX rows drop-down. Note that this is a display control only. All items that meet your filter criteria are included in total metric calculations, even if they are not currently displayed in the table.
Navigate Baseline Report
Each graphable metric in the data table has a corresponding tab and graph above it.
The data graph
- Click on either the data table column header or its corresponding data tab at the top to see a graph of that metric.
- The value displayed within the data tab is that metric’s total value for all items in your entire data set.
The data table
- To sort your data table by a specific metric, click the desired column header. Note that sorting can change which items are shown in the graph, since the graph shows only the first 15 rows currently displayed in the data table.
- For the Project and Client baseline reports, you can drill in to see another level of detail. This allows me to see which specific tasks are contributing to the baseline variance for that project.
- The Totals row at the bottom of the data table automatically calculates the sum of values from columns with time and financial metrics. All items matching the filter criteria are included when calculating metrics in the Totals row, even if all rows matching the criteria are not currently displayed in the table. Click the “limited to xx rows” dropdown to change the number of rows displayed. Note that Overall % Complete is an average of all percentages in that column.
Save and Download Baseline Report
Saved reports are listed in the Analytics Report Library. Each time you run a saved report, it refreshes to reflect your current plan data. If you’d like to keep a static snapshot of the data from a specific report run, be sure to download the report right after you run it.
To save a report
- Name your report
- Click Save to Library
To download a report
- Click Download
- Choose to download in CSV or PDF format
In both download options, the output will include all data columns that are exposed at the time you do the download. The PDF option will prompt you to select other criteria and will also include the data graph for the one metric that is selected at the time you do the download.
Fetch Reports via the API
Analytics baseline data can also be accessed via the LiquidPlanner API. This means you can build custom integrations between LiquidPlanner and your other business intelligence tools or reports you’ve built in Excel or Google Sheets. This allows you to sync data, automate actions, and integrate with other systems to connect your LiquidPlanner baseline data to all parts of your business. Read the section on fetching reports via the API in Analytics Roll-Up Reports for information on how to set this up for your workspace.