Say hello to the new Tempo! LiquidPlanner is now Portfolio Manager.
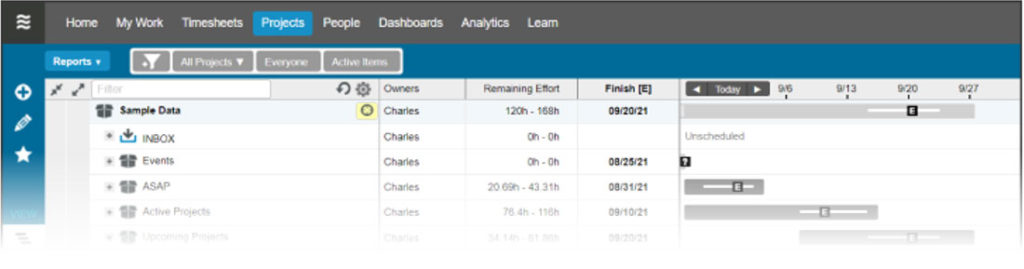
This article provides several examples of Dashboards you can set up. A great dashboard lets you and your project stakeholders see real-time status, updates, risks, and instantly provides the critical details without causing information overload. To learn how to create, customize and share Dashboard, see the Dashboards and Dashboard Widgets help articles.
Here are a couple of things to think about before you start building a dashboard:
1. Keep your audience in mind
Always start by thinking about the audience. They might be stakeholders, clients, internal team members, your manager, or even yourself. You need to understand their goals and requirements in order to populate the dashboard with data that will provide value to that audience.
2. Decide on data
Make sure you choose metrics that will help the audience understand the story you’re trying to tell. The information should be timely and relevant so that the viewer is empowered to take action, if necessary. Date ranges and filters let you get down to the right data.
The examples in this Dashboard Gallery were created from the Blank/Custom dashboard option. Click on an image to see a full-sized view of the dashboard. Our guide to analyzing project data in LiquidPlanner also walks through using dashboards to view team capacity and identify project risks.
Status Dashboard
You’ll want overall completion, remaining work, key milestones and deadlines, and flagged risks right up front. Start planning meetings by displaying this dashboard on your conference room projector.
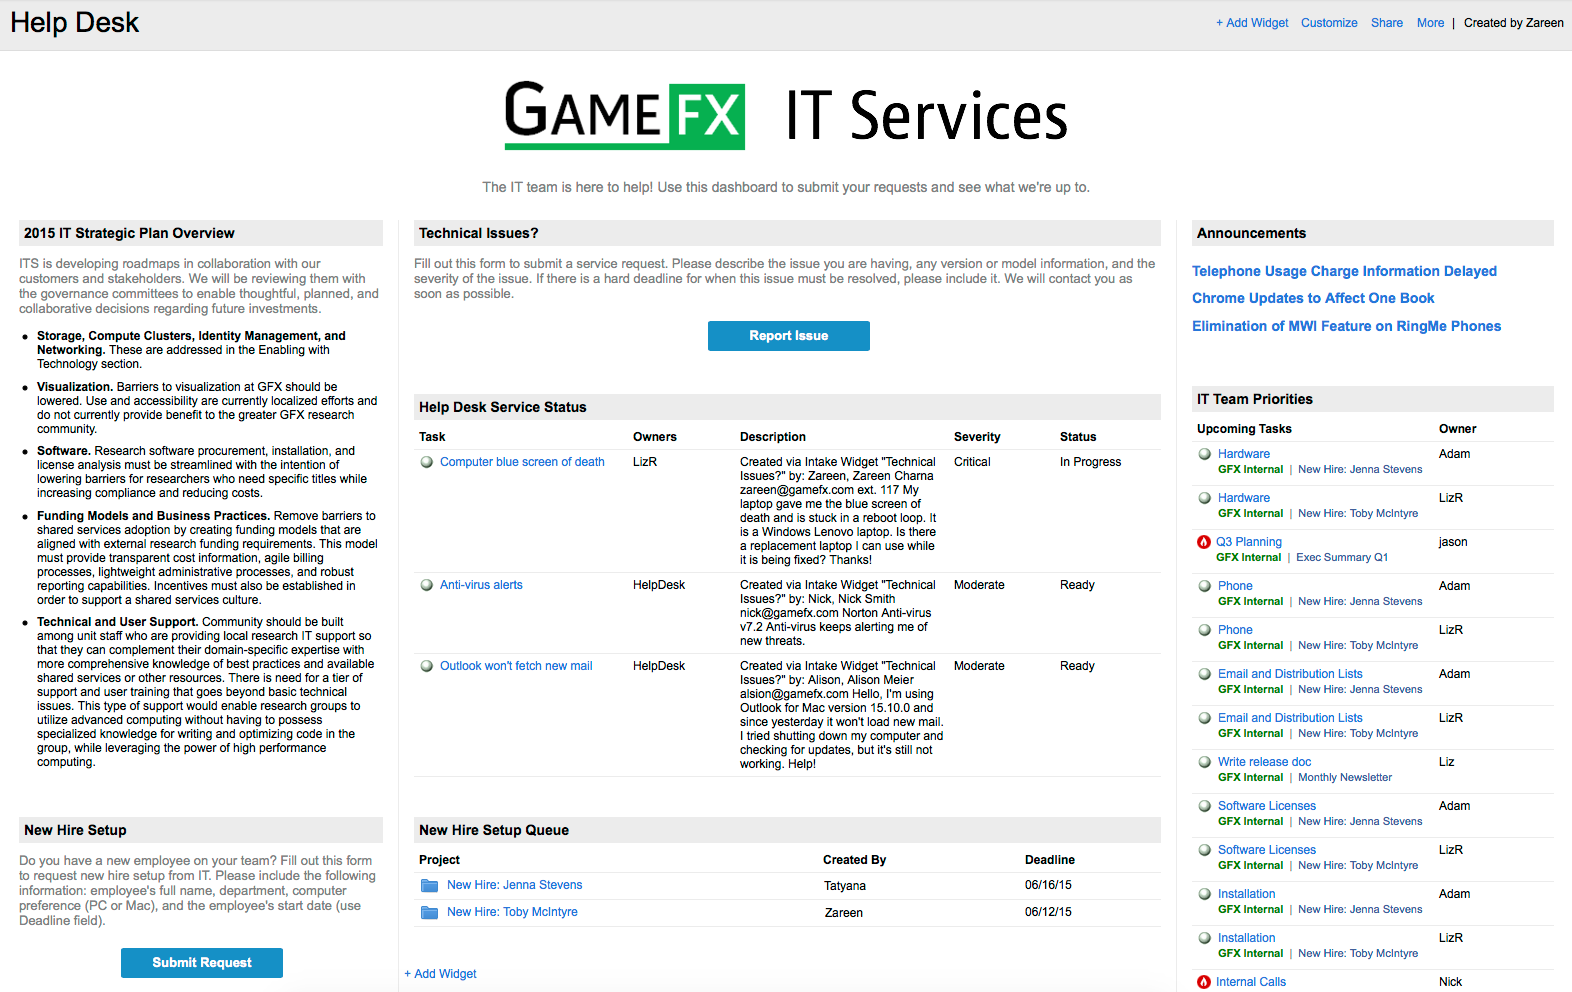
Intake Dashboard
Create a streamlined intake process for members of your workspace and external guests. By adding an Intake Form widget, viewers can fill out a form and submit a new project or task directly from your dashboard. These intake items could be technical issues, bug reports, client feedback, or project requests.
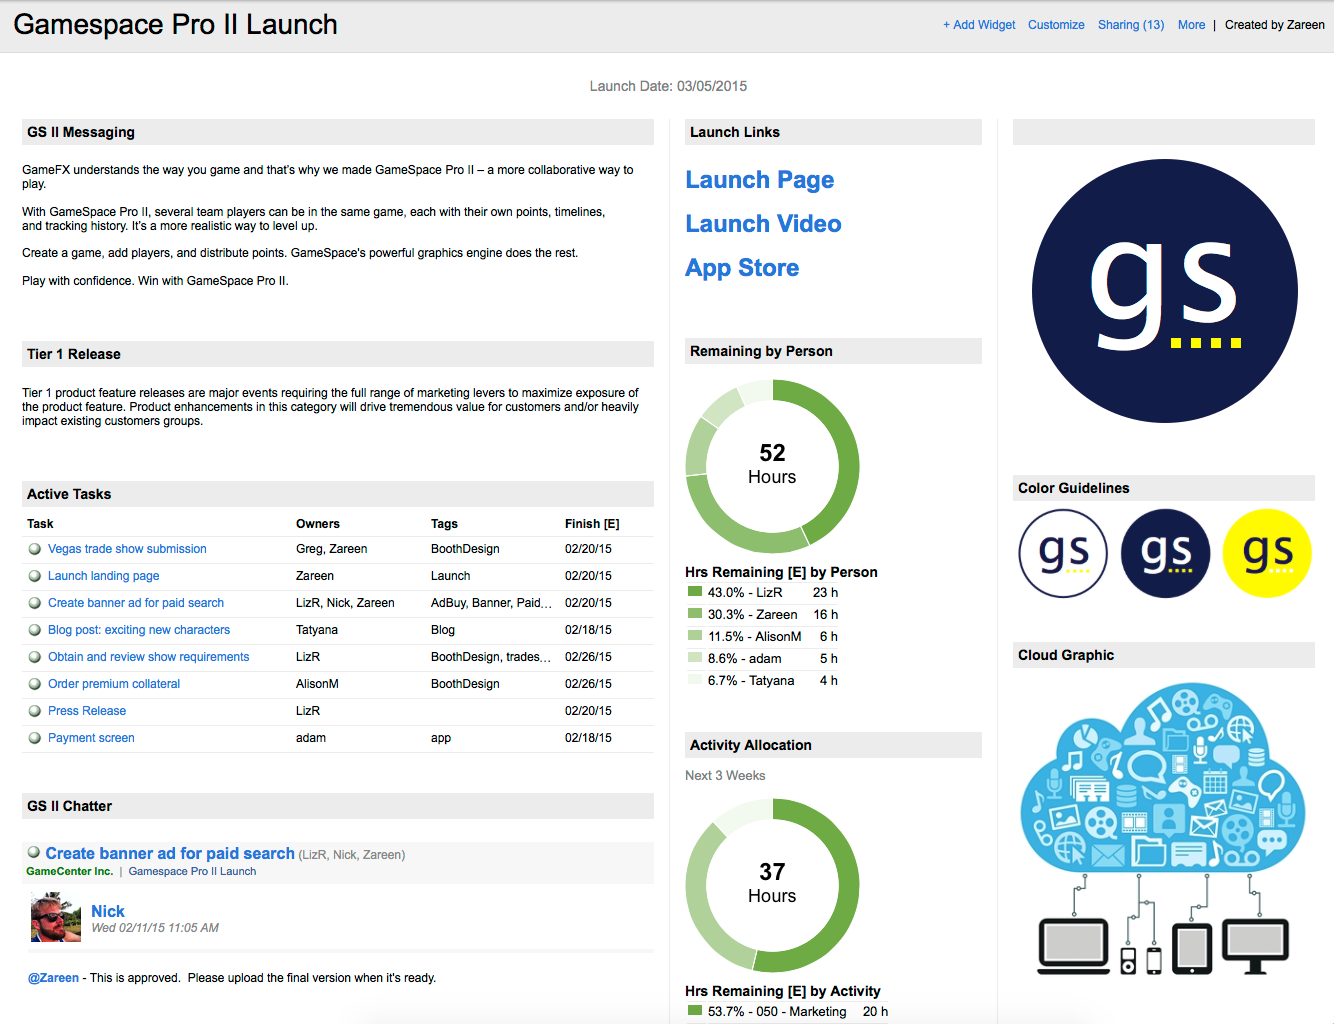
Launch Dashboard
Keep the rest of the organization informed with high-level progress and key messaging for your upcoming product launch. Include graphics, related links, and the launch date, of course! Once you’ve got it configured, you won’t need to keep sending updates – team members can simply visit your dashboard.
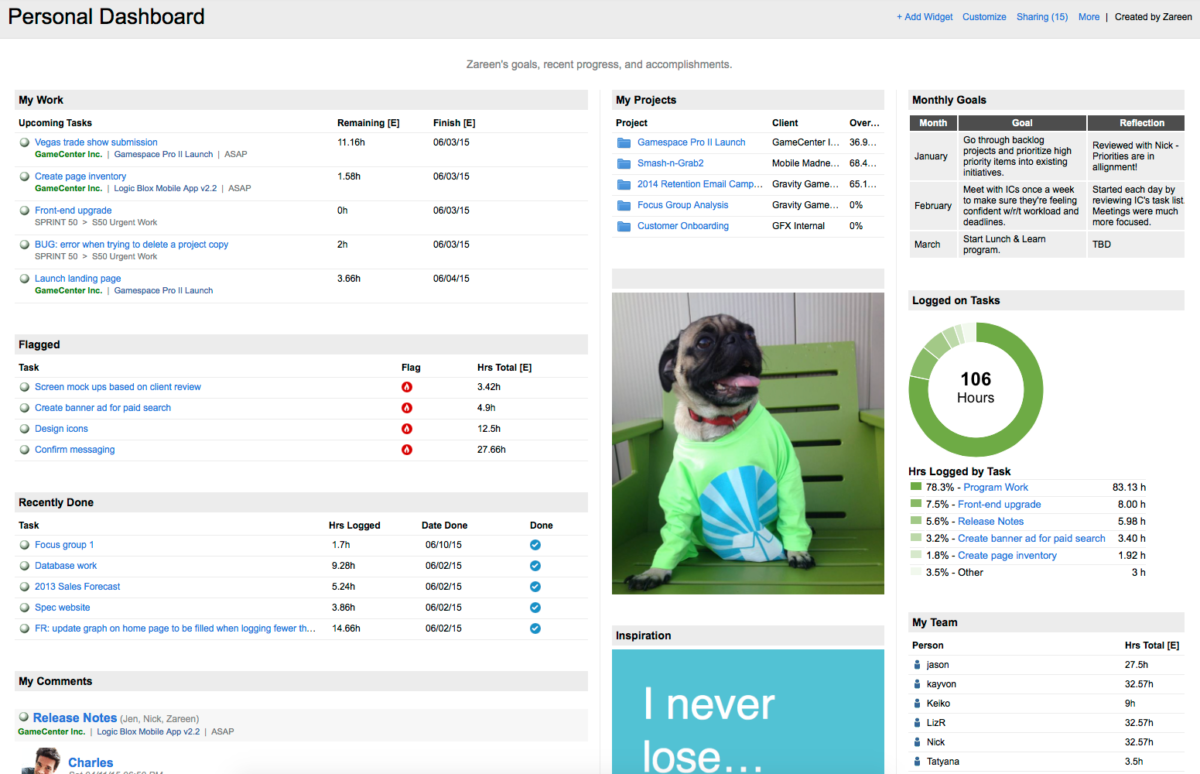
Personal Dashboard
Build a personal dashboard to help you stay on top of conversations and to monitor your accomplishments. Track the hours you’ve logged to specific projects, get a list of your recently completed tasks, or keep your goals in sight. Your dashboard can be completely private or you may wish to share it with your manager to keep them in the loop.
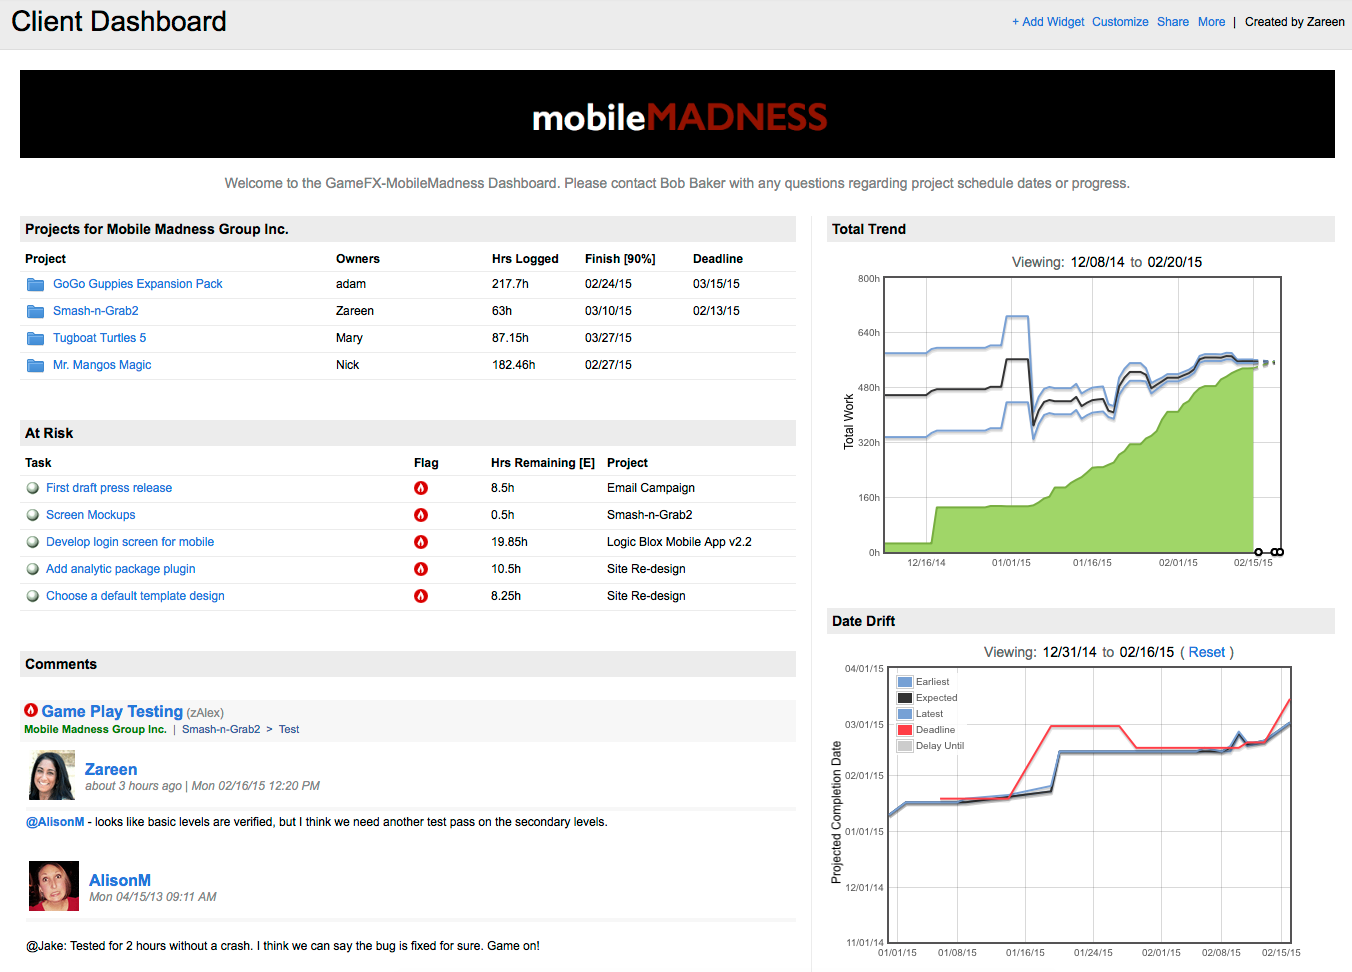
Client Dashboard
Provide your clients with an accurate picture of progress and delivery dates. Set the common filter for the dashboard to a specific client or set of projects. You can decide to expose the 50% likely Finish[E] date or, if you’d like to communicate the best case or worst case scenario, you can show the Finish[10%] or Finish[90%] dates instead. Clients are typically not members of the workspace, so you can invite them to view the real-time dashboard as guests.
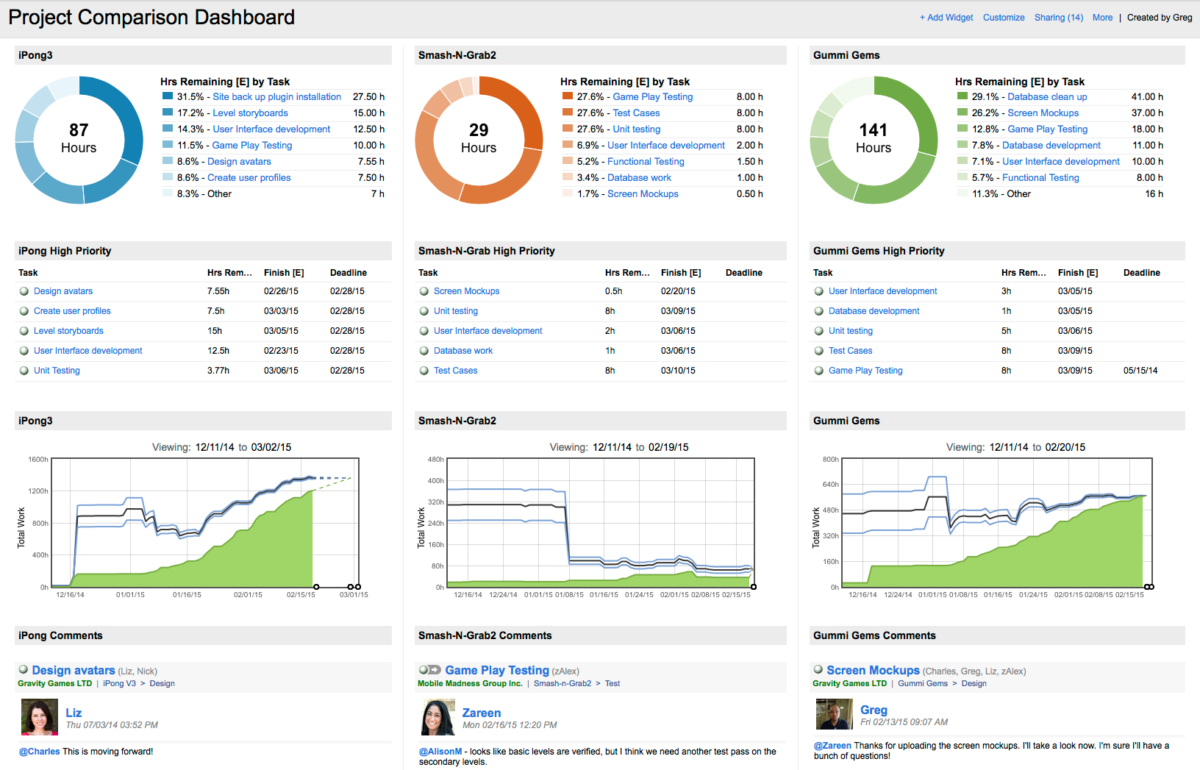
Project Comparison Dashboard
Show a side-by-side view of specific projects, initiatives, or even resources. Use the duplicate function to add the same widgets quickly and then just change the title and filter settings.
Project Requirements Dashboard
Build a dashboard to get all of the key players on the same page about a new product. Provide just enough information to help people understand the project’s requirements. This might include high level status, objectives, background, user stories, or assumptions. Add a document widget and provide links to specs and designs as they become available.
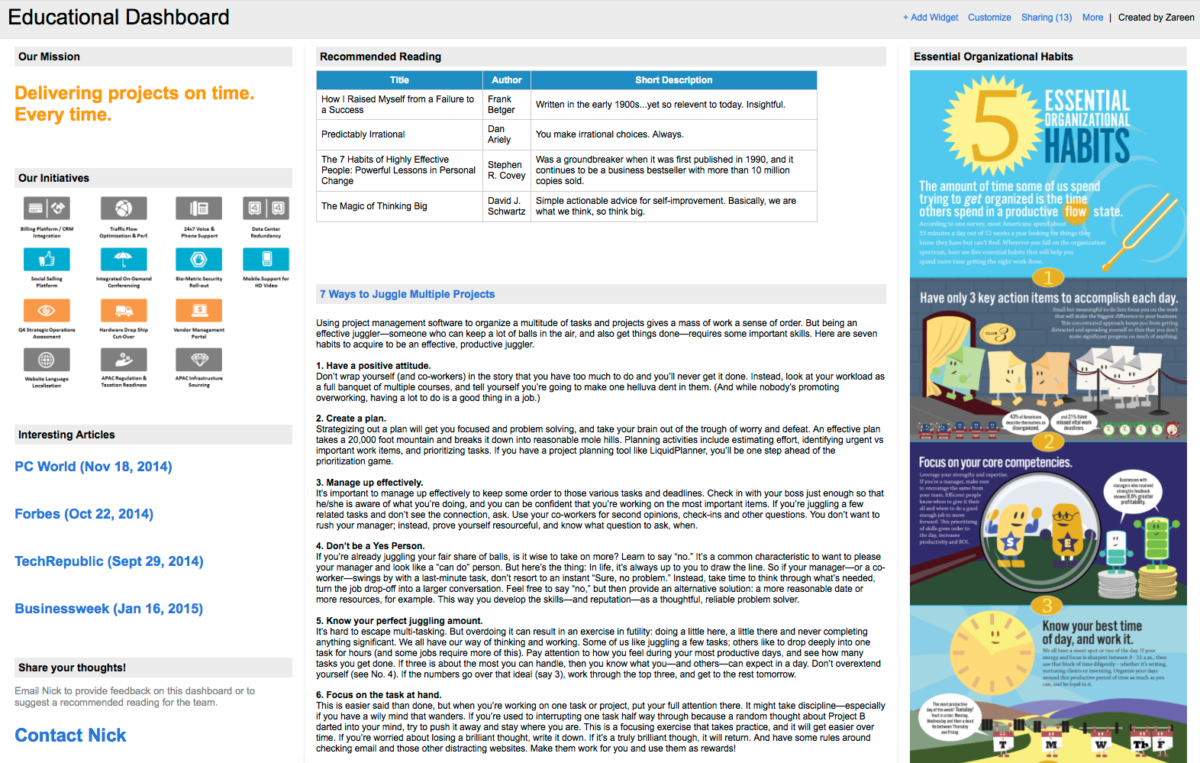
Educational Dashboard
Dashboards are great for sharing project-specific information, but you can also use them as an educational resource. Compile a reading list with external links, communicate company goals, or post an infographic.
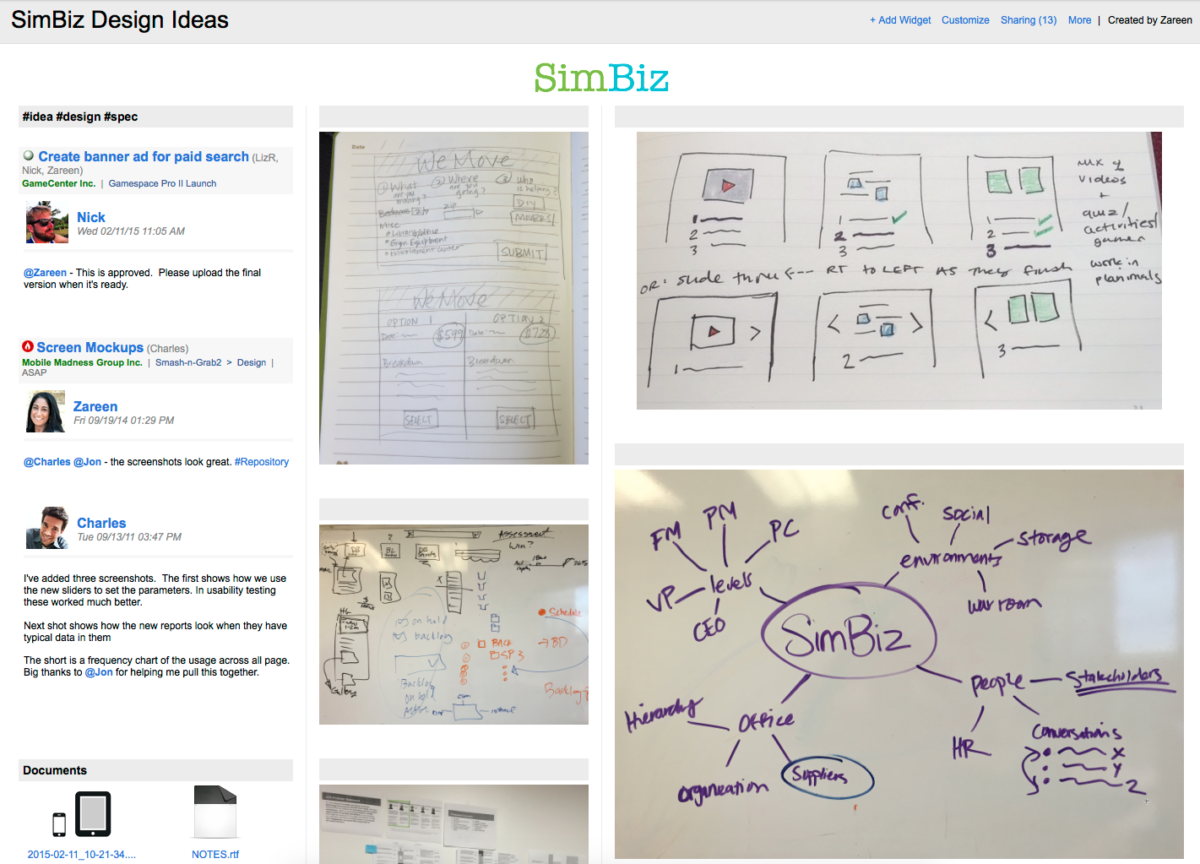
Design Dashboard
Use a dashboard as your virtual drawing board. Group related brainstorms, sketches, and ideas together. Add a comment and/or documents widget and filter to tasks that contain product specs or designs to consolidate feedback from those items.