 Say hello to the new Tempo! LiquidPlanner is now Portfolio Manager.
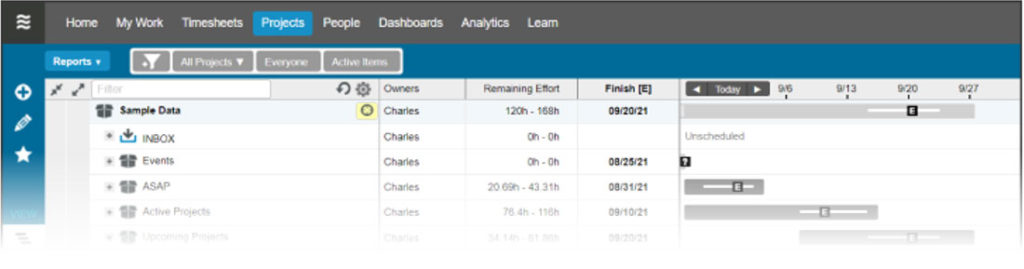
The Remaining Trend report (a.k.a. Burndown Chart) shows the estimated remaining work over time, plus a projection to the probable landing zone.
Use the Remaining Trend
LiquidPlanner’s predefined reports are located in the Reports Menu on the Projects tab. Click Remaining to view the Remaining Trend Report for a selected plan item. To print the report, click the printer icon while in full-screen mode.

Understand the Report
Pick a point on any line and watch the cursor popup to see what the expected remaining effort for the project was as of that point in time.
- The upper blue line is the worst-case (high) estimate of the remaining work.
- The lower blue line is the best-case (low) estimate of the remaining work.
- The black line in the middle is the expected value of the remaining work.

A healthy project will show remaining work that narrows continuously and slopes downwards as work progresses – this means two things:
- Your ranged estimates are being reduced because there is less remaining work as your team is completing their tasks.
- Your team is estimating with more certainty, so the estimates will have a smaller range, thus narrowing the gap between the low and high estimates.

If the black line jumps upwards as shown in the above example, this is a sign of either added scope or consistent underestimation of tasks. If it jumps downward, then this can be a sign of cutting scope to meet deadlines or tracking many hours all at once.
The dotted line that extends from today’s date forward represents when LiquidPlanner expects the project to burn down.
To zoom into a particular region of the report, hover over the graph and use the cursor to select the region you want to focus on.

To learn more about using trend reports in LiquidPlanner, take a look at our guide on monitoring project performance over time.
Trend data is not available for dates prior to 6/15/2013.