 Live webinar: Mastering Project Forecasting in Jira with Portfolio Manager
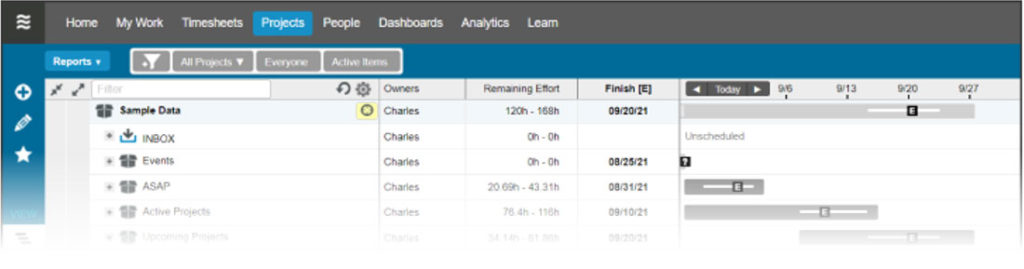
The Date Drift report (a.k.a. the Slip Report) plots the expected finish date for a plan item over time. For a project, it shows you where the project was expected to exit at any point in it’s lifetime.
Use Date Drift
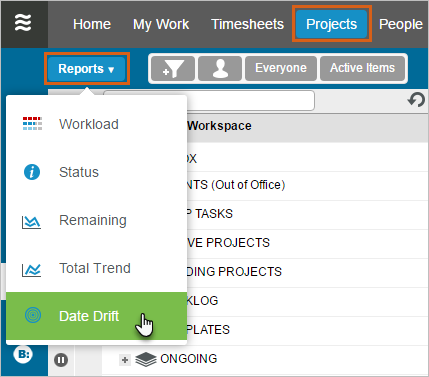
LiquidPlanner’s predefined reports are located in the Reports Menu on the Projects tab. Click Date Drift to view the Date Drift Report for a selected plan item. To print the report, click the printer icon while in full-screen mode.
Understand the Report
- The upper blue line is the worst-case (high) estimate of the finish date.
- The lower blue line is the best-case (low) estimate of the finish date.
- The black line in the middle is the expected finish of the remaining work.
- The red line represents the deadline date for this project
Hover over any point on any line and see the text pop up of what the deadline or projected finish date was as of that point in time.

If the black line is flat (no slope) as pictured in the example above, that means that your expected finish date has stayed the same, so work is being done at a rate that will allow your project to finish on the date you originally planned for — great!
If the lines are sloping upwards to the right, that means that your expected finish date has slipped. This might happen if the work is taking longer than expected or if scope has been added.
If you have a deadline set on the item, that date will be plotted as a red line. A little bit of upward creeping is okay as long as the black expected finish line stays beneath the deadline in red.

You can see in the example above that the gap between the earliest and latest finish dates narrows over time, which is a good sign that uncertainty in the plan is being reduced. However, the finish date for the project slipped by a couple of weeks, so the deadline was renegotiated to accommodate the slip in the schedule.
To learn more about using trend reports in LiquidPlanner, take a look at our guide on monitoring project performance over time.
Trend data for this report is not available for dates prior to 2/14/2009.