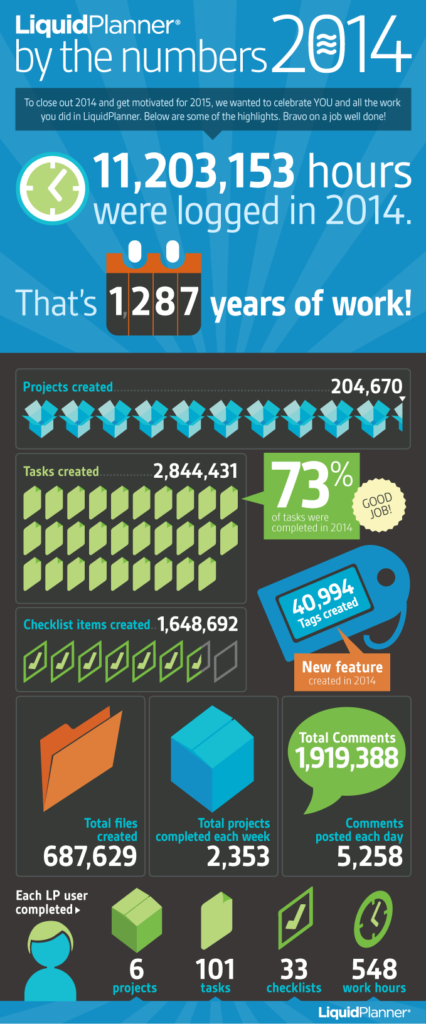
Check out your productivity!
If you used LiquidPlanner last year to manage projects and resources, you’re part of a community of very industrious people. With 2014 in our rear view mirror, we looked under the hood of our project management software to get all the juicy data points. From projects created and completed to the number of work hours and comments generated—check out these impressive figures. (Click to see a larger version.)


