 Say hello to the new Tempo! LiquidPlanner is now Portfolio Manager.
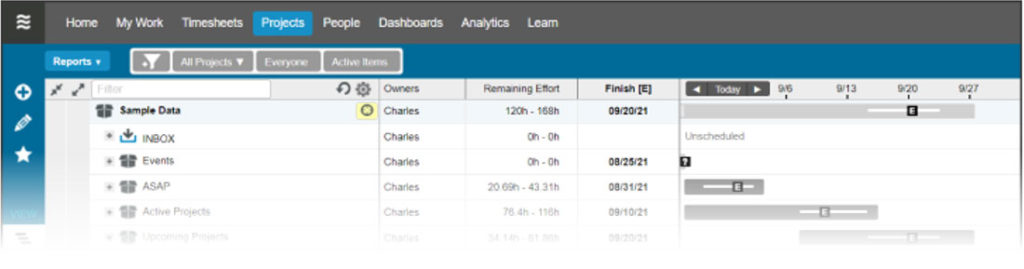
The Project Workload report on the Projects tab allows you to visualize team utilization and workload distribution within a project or group of projects. The report displays each resource’s assignments distributed across calendar days. In the Project Workload report, you’re able to quickly see the project team, their remaining assignments, completion dates, whether their work is at-risk and which resources are ultimately driving the finish date of the project. With this information, managers have the data to load balance projects in real time and be proactive about managing project risk.
Report Assumptions
The Project Workload report is able to accurately forecast workload for each project in your workspace because of LiquidPlanner’s unique priority-based scheduling methodology. In order to see useful workload data in this report, make sure that tasks have been assigned to real or virtual members and that you’re using these core features:
- Ranged Estimates – Workload can only be calculated if the number of hours that the work is expected to take has been entered on tasks.
- Prioritization – Work needs to be arranged in priority order on the Projects tab so that it can be scheduled appropriately and workload can be shown for different timeframes.
- Deadlines – The report can only show risks if deadlines have been set on packages, projects, or tasks.
- Availability – Every workspace member needs to have their profile Availability set to reflect the number of hours per day that they will spend on work that is represented in LiquidPlanner.
Configure The Report
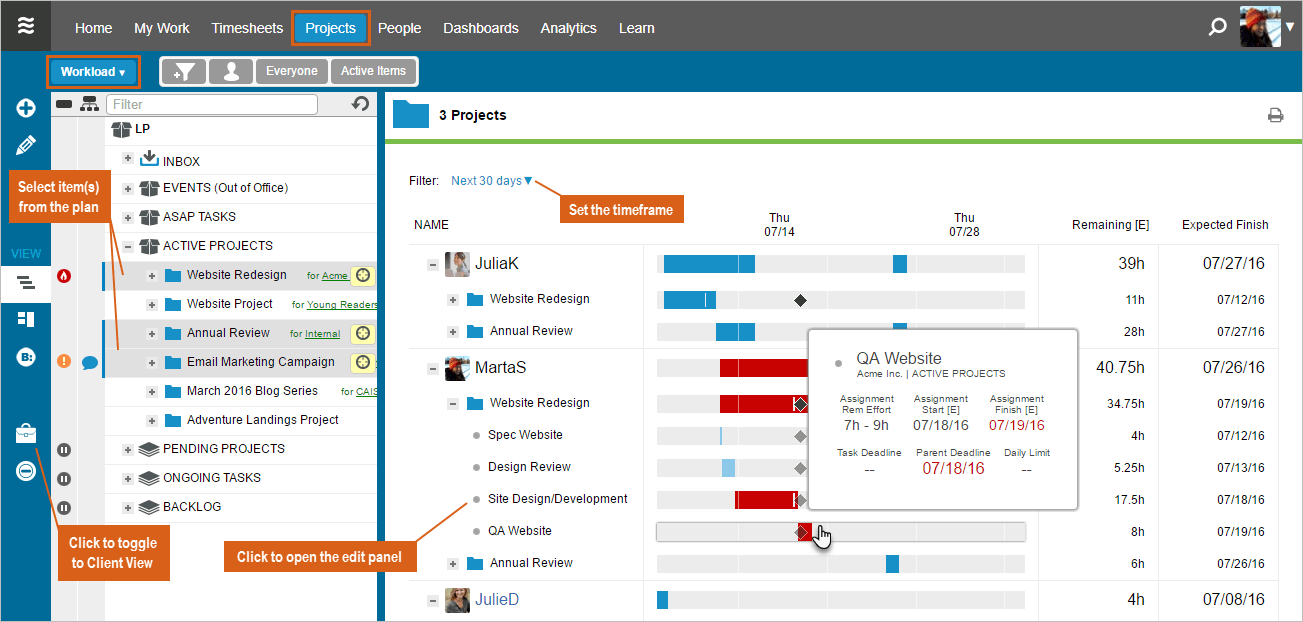
Any workspace member can run the Project Workload report from the Projects tab.
- Go to the Projects tab.
- Click on the Reports menu and choose Workload.
- Select an item or group of items from the project plan.
- Adjust the timeframe (optional).
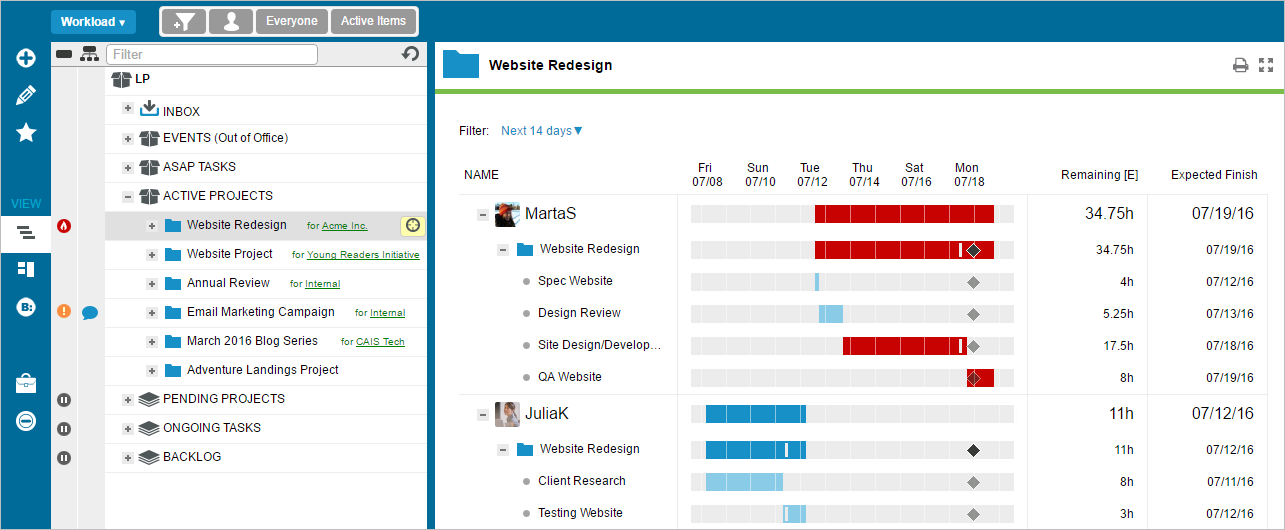
Viewing resources
To see details for a specific resource, expand the person row by clicking the + icon or by clicking directly on the workload bar. To change an assignment or make additional edits, click on the plan item name to open the edit panel.
Selecting plan items
Use Project Workload on any of the following items: Package, Project, Subfolder, Task, or Client.
To run the report for multiple items, simply select an entire package or multi-select specific packages, projects, subfolders and/or tasks to view resource allocation for those items.
Use Project Workload with Client View to view workload information across all of the work you’re doing for a client. Simply toggle to Client View, run the Project Workload report and select a client (or multiple clients) to see how resources are allocated across all of the projects for that client.
Understand Project Workload
The report reflects future expected hours and dates by person based on individual assignment data from the selected projects. Each person displayed in the report has one or more active assignments on the project within the selected timeframe.
Timeframe
When using Project Workload, the timeframe auto-adjusts to include the latest finish date of the selected items. Change the timeframe to view the report in the near term or further into the future from Next 7 days to Next 365 days. Remember that the workload bars are showing when each resource is expected to start and finish their work; which is not necessarily when the plan item will start or finish.
The Expected Finish date is the only calculation in this report that doesn’t respect the timeframe. This is because it’s useful to know when a resource will be done with something, regardless of the timeframe. The report lists resources in order of latest expected finish date at the top. In other words, resources at the top have work from that project scheduled further into the future. These are the resources that are ultimately driving the finish date of the project.
Effort
The Project Workload report displays a column for Remaining [E], which is the amount of work still left to do (based on ranged estimates). Use this column to see exactly how much work remains in the project for each resource and how it’s distributed across the project team.
Deadline Risk
If the workload bar is blue, the resource doesn’t have work from the selected project that is at-risk for missing a deadline within the timeframe. If the workload bar is red, that person has one or more assignments within the timeframe that are at-risk. This makes it easy to scan the list of resources and see who might need attention. To find out which specific item is at risk, click on that person’s workload bar to expand the selection.
When To Use Project Workload
Below are a few scenarios for which the Project Workload report helps project managers and functional or department managers understand resourcing information.
Know the health of your project
If you’re a project manager and you need to know the health of a project, you can use the Project Workload report to get a sense for when resources are scheduled to work on your project and which resources are driving the project’s finish date.
- Select a project from the plan.
- Change the timeframe depending on how far into the future you’d like to view workload information.
- If you see that one of the resource’s workload bars is red, expand that person’s workload bar to find out what items are at risk.
- Have a conversation with team members who have at-risk work to find out if there are any issues blocking them from completing the work by the deadline.
- Take a look at the other resources in the project to see if anyone already on that project team has any gaps in their workload bars that could potentially lend a helping hand. This is a good time to check in with the team member or their manager to decide the best course of action to resolve the risk given any other competing priorities.
Run weekly project status meetings
As a project manager, it’s important to understand project progress and roadblocks. In a weekly project status meeting, use the Project Workload report as a visual to help drive the meeting.
- Select a project from the plan.
- Since the timeframe auto-adjusts to include the finish date of the project, use this initial view to get a sense for all remaining work in the project and how it’s distributed across resources by looking at the Remaining [E] column.
- Notice which resources are listed at the top, driving the finish date of the project and pay attention to any red workload bars.
- Use the workload bars as supporting visuals as team members give updates.
- Then, set the timeframe to Next 7 days to drill into what everyone is scheduled to work on in that project in the next week.
- If necessary, reassign at-risk work from one resource to another resource who is able to take on the work.
During the meeting, you may need to re-estimate, reassign, or reprioritize work in the project. Make updates in real time directly from the Project Workload report by clicking on an item name to open the edit panel on the right or drag and drop to re-prioritize items on the left.
Plan a future project
When planning an upcoming project, project managers need to know how work will be distributed across the project team and how the new project will fit in with the rest of the plan. Using Project Workload can help load balance resources for a new project before it even begins.
- Make sure you’ve built out the new project in LiquidPlanner and that the project has estimated tasks that are assigned to real or virtual members.
- Run the Project Workload report on the new project.
- Look to see how work is allocated by looking at the Remaining [E] column to see if anything should be reassigned to distribute work more evenly across the project team.
To better understand exactly which resources have available hours to take on work in a new project, it’s important to look at all of the other work they are assigned to. This can be done by multi-selecting projects or packages in Project Workload or by using the Resource Workload report on the People tab, which displays workload across all items in the workspace.
Important Considerations
- The report references hours remaining within the specified timeframe.
- Hours from Events assigned to ‘Everyone’ will not be included in the per person ‘Remaining [E]’ calculation.
- Filters can’t be applied to the data that is shown in the Project Workload report. However, you may find it helpful to use filters to narrow down the plan making it easier to locate the items you wish to select for the report.
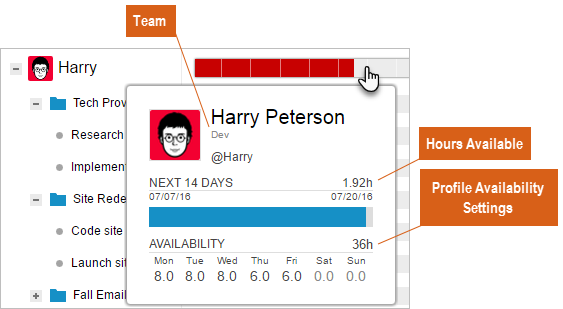
- Hover over the workload bar of a single resource to view the person summary pop-up, which displays that resource’s team and availability settings per day as well as a utilization bar for the next 14 days:
Save the report by clicking on the printer icon in the upper right of the Workload Report and use your browser’s print functionality to save as a PDF. In some browsers, you’ll need to check a box to include “background graphics” to see plan item icons.