LiquidPlanner’s Dashboards features is a powerful visual tool that lets you share selected project information with team members and stakeholders—inside and outside of your company.
Dashboards are fun to make and to use because they have a big impact in such a simple way. For example, dashboards let you select the exact project data for just the right people who need it; and, they’re visual which means you can give and receive valuable intel at a glance. Use them to reveal resource management and planning stats, to on top of project schedules, collaborate more effectively with your team and more.
Here, we’re going to tell you what Dashboards do, give you some guidelines for creating them, and then show some examples of different types of Dashboards. But really—the possibilities are endless. Someone will probably create a dashboard that will make you go “Wow, I never thought of that!,” something we’ve been experiencing around the LiquidPlanner offices. So, let’s dive in.
Dashboards 101
A good dashboard keeps you informed by grouping relevant information together. A great dashboard lets you and your project stakeholders see the real-time status, updates, and risks, and it also instantly provides critical details without causing information overload.
Dashboards can look different depending on your team, the type of work that you do and the metrics that are important to you. Here are a couple of things to think about before you start creating your own dashboard:
1. Define the audience
Always start by thinking about your audience. They might be stakeholders, clients, internal team members, your manager or even yourself. You need to understand the goals and requirements of your audience(s) in order to populate the dashboard with data that will provide the most value.
2. Decide on data
Make sure you choose metrics that will help your dashboard audience understand the story you’re trying to tell. The information should be timely and relevant so that the viewer is empowered to take action, if necessary. Date ranges and filters let you get down to the right data.
Check out these dashboards
We’ve put together a small gallery of dashboards to use as examples and inspiration to get you started. Click on each one for a larger image.
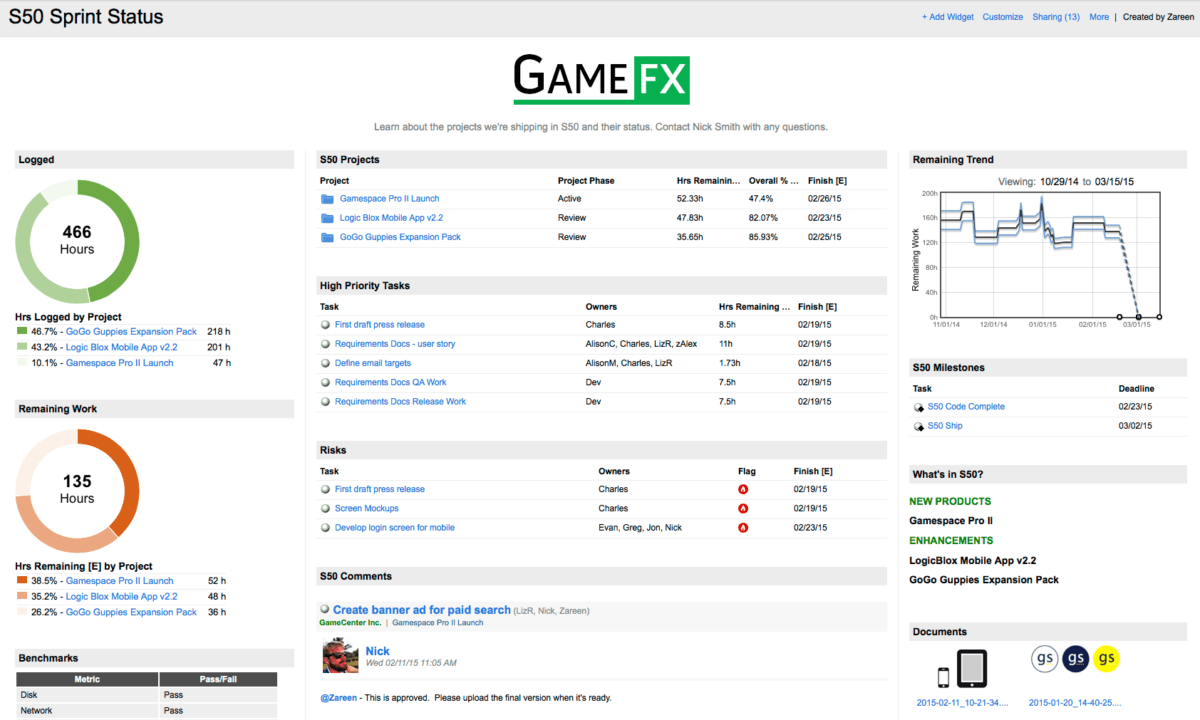
Status dashboard
You’ll want overall completion, remaining work, key milestones and deadlines, and flagged risks right up front. Start planning meetings by displaying this dashboard on your conference room projector.
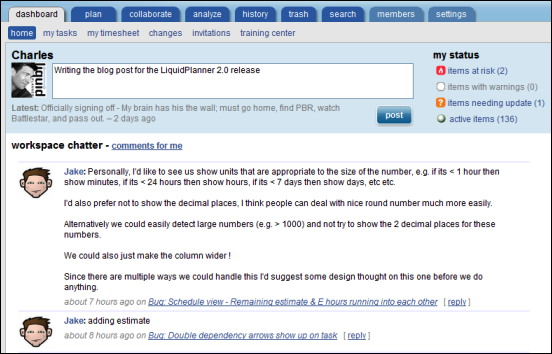
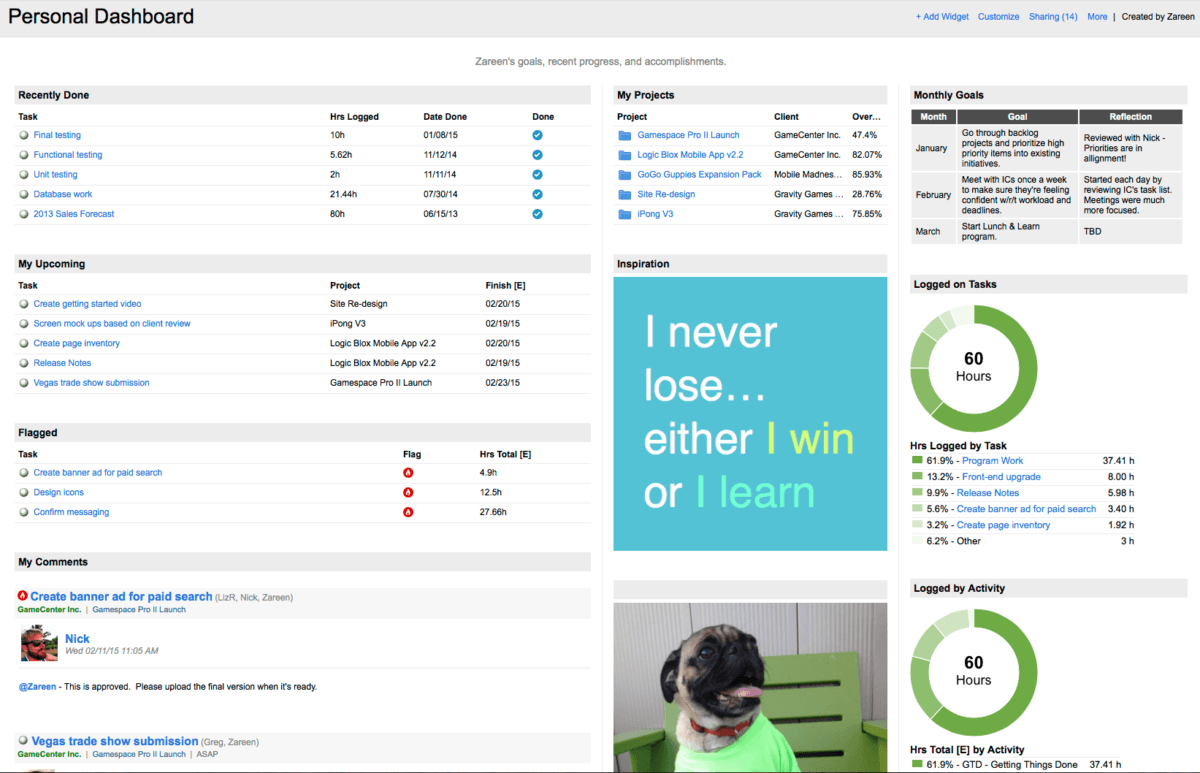
Personal dashboard
Build a personal dashboard to help you stay on top of conversations and to monitor your accomplishments. Track the hours you’ve logged to specific projects, get a list of your recently completed tasks, or keep your goals in sight. Your dashboard can be completely private; or, you might wish to share it with your manager to keep her in the loop.
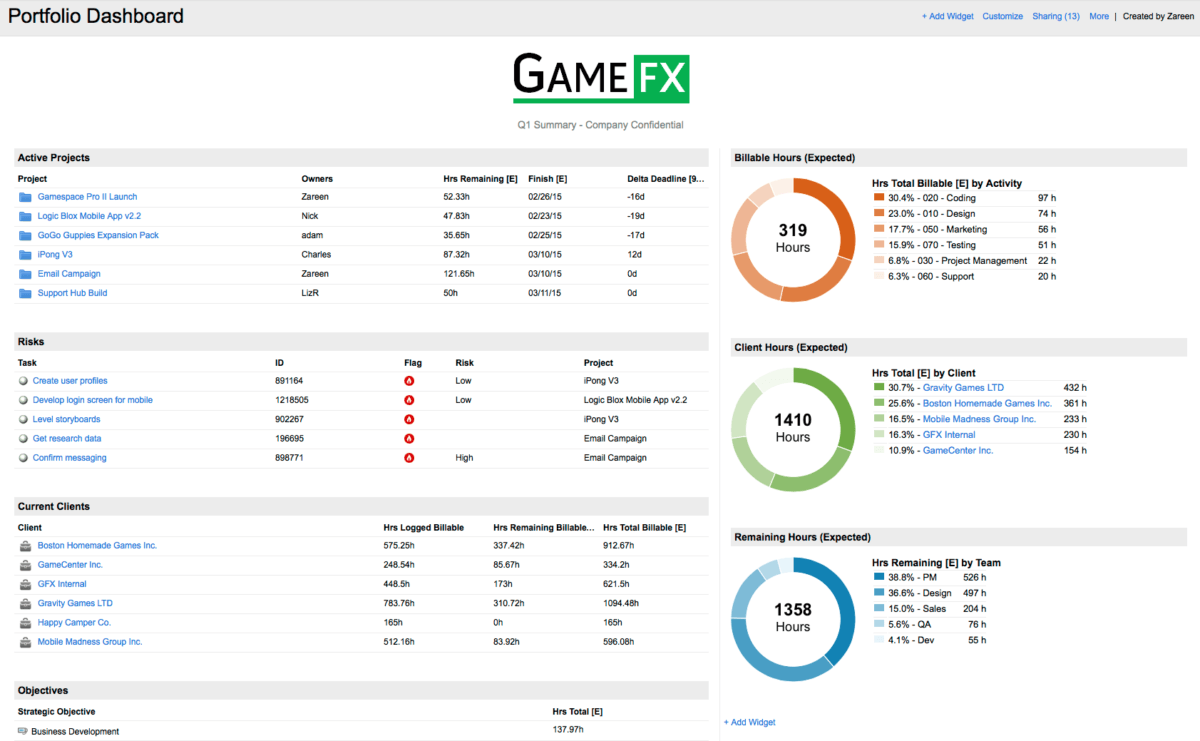
Portfolio dashboard
A portfolio dashboard provides a bird’s eye view for executives. You can include a project breakdown for every team, or show summarizing metrics for the whole workspace. Pay special attention to column sizes and the number of widgets you use. In some cases, less is more!
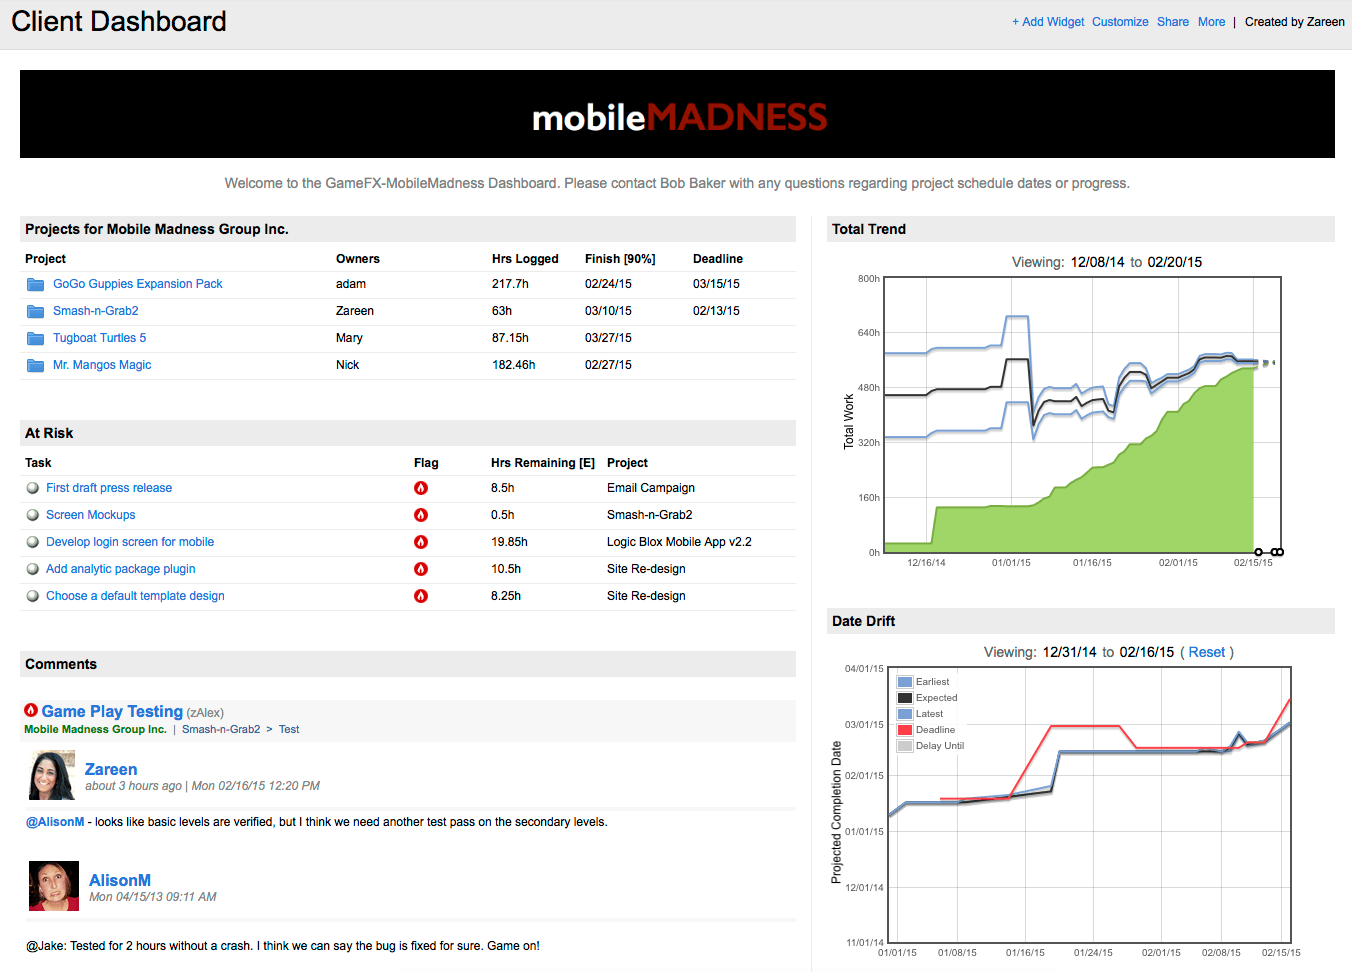
Client dashboard
Provide your clients with an accurate picture of progress and delivery dates. Start by setting the common filter for the dashboard to a specific client or set of projects. You can decide to expose the 50% likely Finish[E] date or, if you’d like to communicate the best case or worst case scenario, you can show the Finish[10%] or Finish[90%] dates instead. Clients are typically not members of the workspace, so you can invite them in as guests to see their project status in real-time on your dashboard.
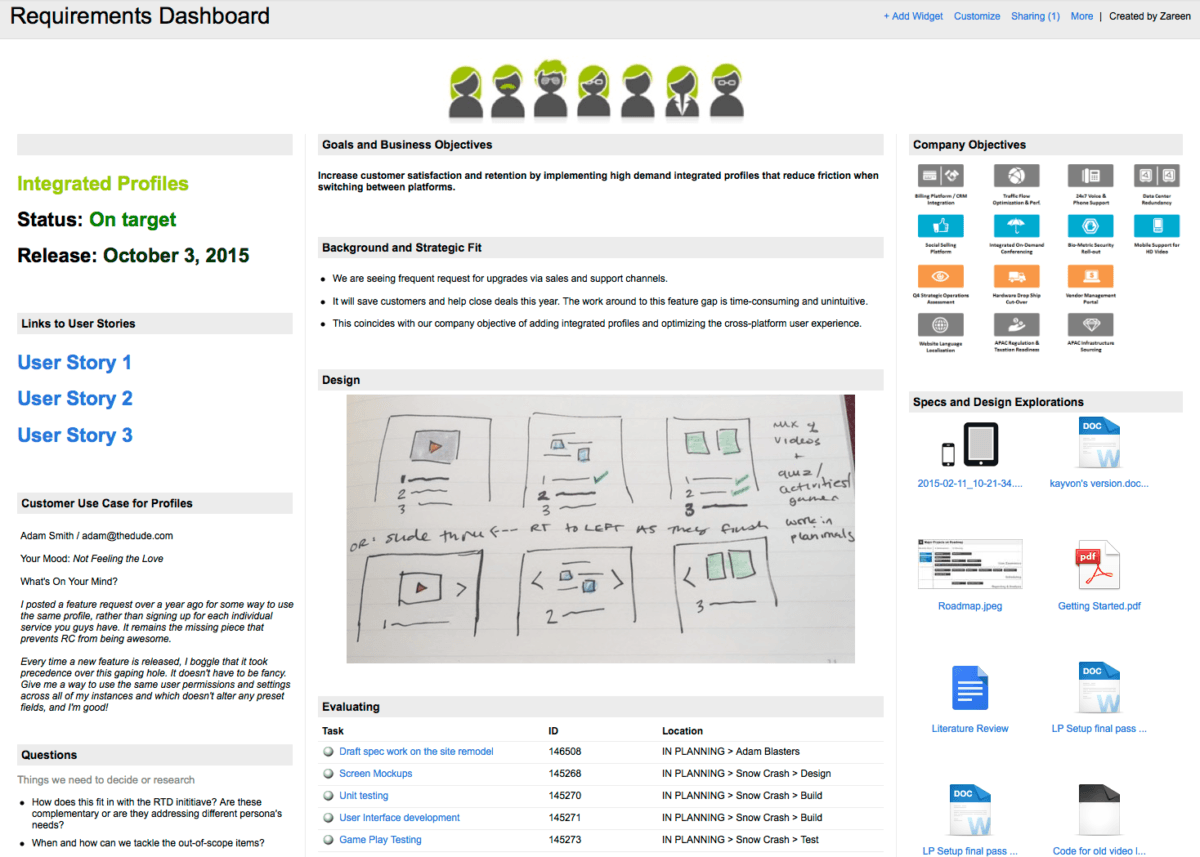
Project requirements dashboard
Build a dashboard to get all of the key players on the same page about a new product. Provide just enough information to help people understand the project’s requirements. This might include high-level status, objectives, background, user stories or assumptions. Add a document widget and provide links to specs and designs as they become available.
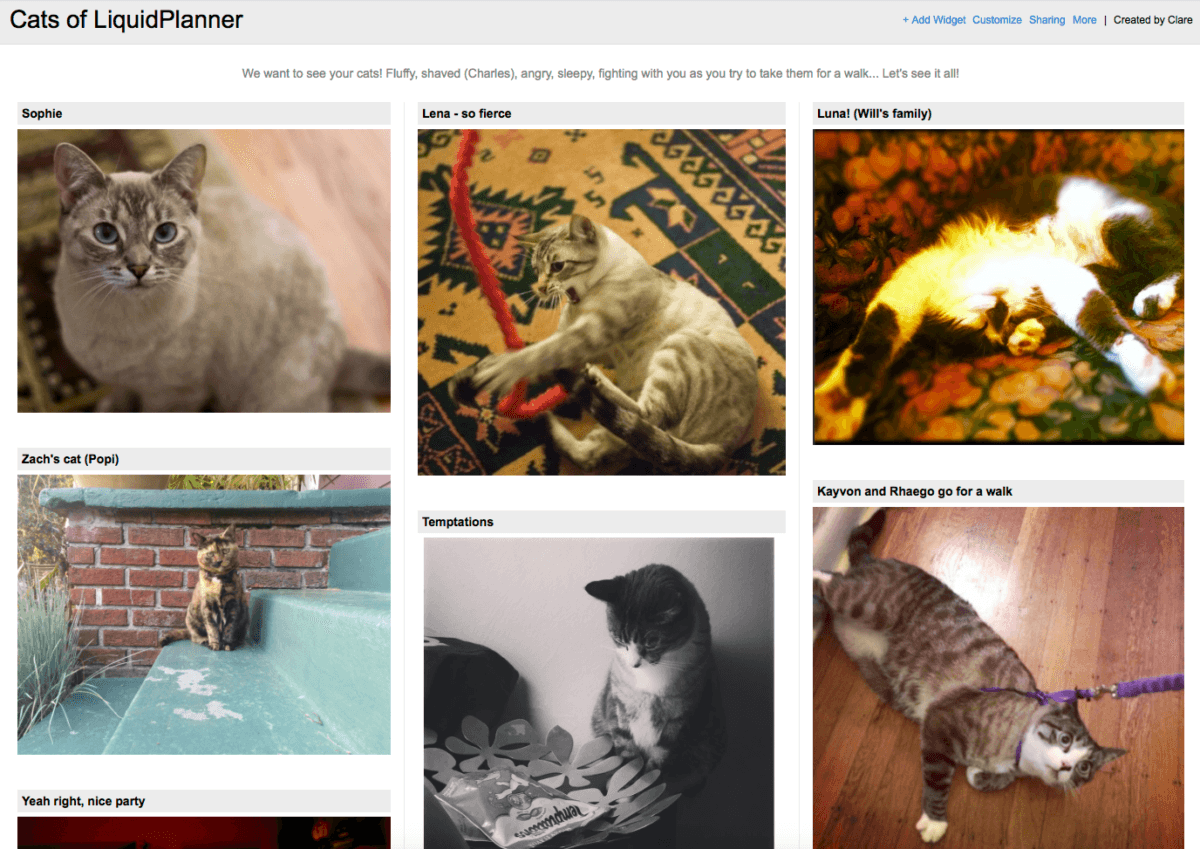
But wait—there’s more. Sometimes, just sometimes, you might have some fun with your dashboards as well, case in point:
You can see more examples at the LiquidPlanner Dashboard Gallery. For more details on using Dashboards, see this help article.