Last week we introduced you to Dashboards, our new powerful project management feature that lets you share and access selected information. We also provided a few different ways you can use dashboards. This week, we’re going to show you basic tips to help you set up and use your dashboards to their full potential.
1. Adding widgets
Widgets are what make up your dashboard. To start configuring your dashboard, go to the upper-right hand corner of your screen and click + Add Widget. Select the type of widget you want, then configure it in the table provided. You can name it, provide a description and add filters.
Here’s a rundown of what your widgets are and what they do.
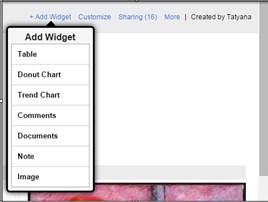
- The Table, Donut Chart and Trend Charts are your analytics widgets. Use these to drive project insights at a glance.
- The Comments widget surfaces comment streams—and you can filter them. For example, if you’re creating a project-specific dashboard, you can set a filter to show just comments around your chosen project.
- Documents gives you access to a plan items’ attached files directly from your dashboard—and again, you can filter your documents widget down to zoom in on just what you need.
- The Note widget is a place to enter any text you want. For example: meeting notes, reminders and to-dos, rough spec drafts, love notes, you name it.
- The Image widget lets you upload screen shots, PDFs, photographs, etc. You might use this for screen shots of project plans and design drafts; a snapshot of a whiteboard with meeting notes, and maybe a vacation photos on your personal dashboard.
You can design your dashboard to have from one to four columns. Play around and see what you like.
2. Sharing your dashboard
The sharing functionality really kicks dashboards into high gear. You have a few choices of how you share them (or don’t).
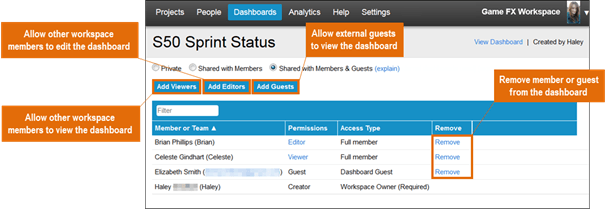
- To start, you can select whether you want to keep your dashboard Private (e.g., personal dashboards or skunkworks projects); you can share a dashboard with Members; or share it with Members & Guests. This last one is the external sharing option. You have to have owner and co-owner access to use externally.
- Next, you can Add Viewers, or Add Editors. Viewers access your dashboard on a read-only basis. Editors can get in there and make changes and updates.
Whenever you share your dashboard, those invited in will receive an email notification letting them know—and receive a link directly to that dashboard.
3. Filtering
Filtering lets you focus in on just the information and data you want to see on your dashboards. Filters apply directly to the Table, Donut, Comments and Documents widgets. So, let’s say you have a dashboard for Sprint 99, you probably want to surface project info and analytics just for Sprint 99.
You can set common filters and individual filters. Heres’ how:
Common filters:
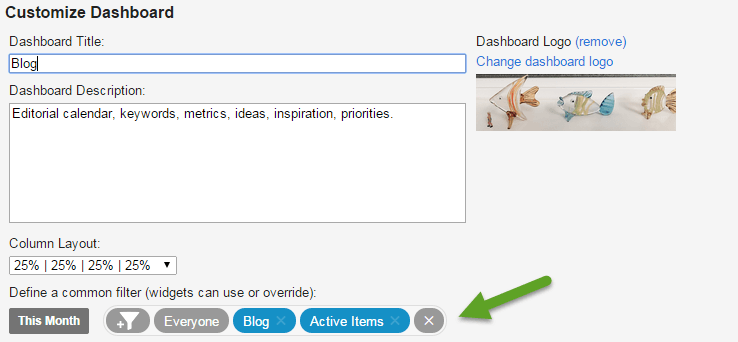
To set filters, select Customize in the upper-right corner of your Dashboards screen. Here, you’ll see a place to “Define a common filter.” This sets a universal filter for the entire dashboard and all the widgets. Here’s an example of my Blog dashboard. My filters have been set to show information from the last month (comments, documents, analytics, etc.); the people filter is Everyone; the package filter is Blog, and I’ll see just active items.
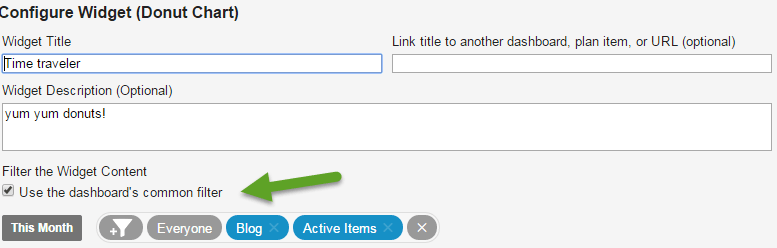
Now on to your filterable widgets. On your Configure Widget screen, you’ll see a “Use the dashboard’s common filter.” What this means is that your widget (in this case the donut chart) has the same filter settings applied as the ones to your dashboard.
Overriding the filter
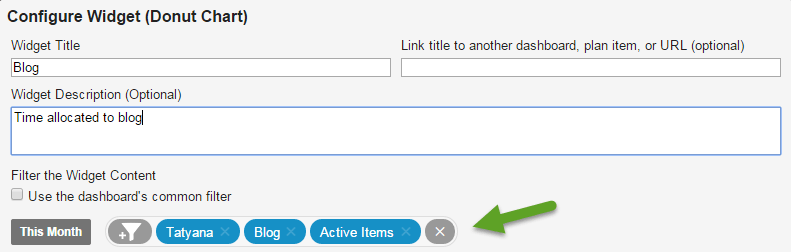
To override filters simply de-select “Use the dashboard’s common filter,” and select your new filter settings. For example, if I want to use the donut chart to see the hours I’ve allocated to the blog, I can filter this widget to me, “Tatyana.”
These use cases are just the tip of the Dashboard iceberg. There’s a lot more—some of which you’ll learn as you continue using Dashboards.
To get more detailed Dashboard tips, sign up for our Dashboards webinar, where we’ll show you some of the magical tricks of the dashboard trade.