Since its introduction in the 1910s, the Gantt chart has remained a staple of the project manager’s toolset. Today, it’s still the go-to way of graphically displaying all of the tasks that make up a project and their progress towards completion.
Traditionally geared towards the planning of large-scale Waterfall-type engineering projects, Gantt charts are now also being adapted for use in Agile and other more dynamic environments; they’re featured in just about every piece of project management and planning software out there. You can even create Gantt charts in applications like Microsoft Excel, though it does beg the question of why when there are hundreds of better-suited tools for the job. It’s like choosing Word as your spreadsheet program.
But how does the elder statesman that is the Gantt chart fit into the vibrant, youthful, fast-moving world of Agile and more dynamic projects and still get the respect and attention it’s due? In truth, only by learning some new tricks.
Historically, Gantt charts have been the product of a deterministic approach to planning—a process that doesn’t fit smoothly into a project environment where uncertainty is endemic and change is guaranteed. Chances are, the first Gantt chart you generate is also the last, because it simply can’t keep pace with the work being done. And so, just like many schedules that came before, it quickly falls into disuse.
Smarter, More Relevant Gantt Charts
LiquidPlanner tackles this Gantt chart issue in a unique way by employing a predictive scheduling methodology that provides you with a visual schedule that takes uncertainty into account and removes the need for constant date changing.
Here are four ways that LiquidPlanner’s Gantt charts are different, and why they’re smarter.
1. Flexible finish dates
Gantt bars are Gantt bars right? They all show the planned start and finish date for each plan item; they show dates entered by someone based on when they think work can start and how long it will take. You pick a finish date and cross your fingers, hoping that the bar on the chart is close to being realistic.
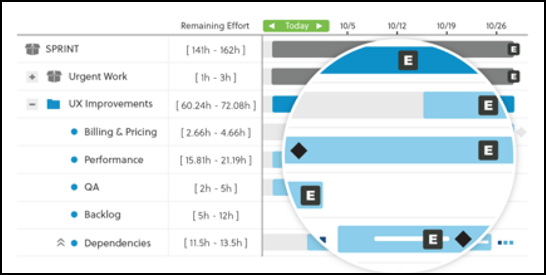
Not so with LiquidPlanner. Their Gantt-style bars, which are called schedule bars, show a range of possible finish dates that are automatically calculated by the scheduling engine based on the best case and worst case work estimates entered for a task. The expected finish [E] is the mid-point between the two.
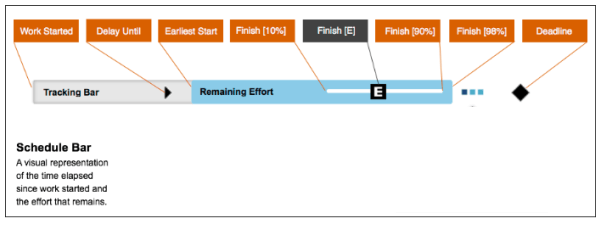
The range of dates that the schedule bar represents allows you to see the uncertainty expressed in the underlying ranged estimate. The schedule bars highlight remaining work only, since you need to be focused on the work that still needs doing—not what’s been done.
Drift the mouse anywhere over the schedule bar and you’ll get a pop-up showing the expected finish:
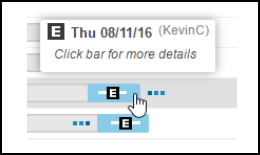
And if you click on the bar itself you’ll get further data for that task or project:
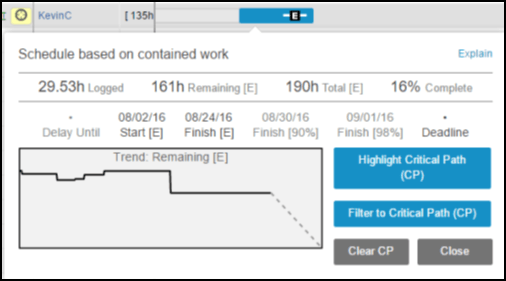
All the information you need with just a few clicks.
2. Automatic updates
The LiquidPlanner schedule is updated automatically in real-time as team members log the work that’s been completed and revise the remaining work estimates. And this is all reflected in the schedule bars that show all the work progress for every task that rolls up to a project.
There is no need for the schedule owner to manually update progress or check in updates received from others. If a task that’s scheduled to be completed today isn’t marked as complete today, it will be automatically rescheduled to be worked on tomorrow, again; with no need for any manual date tweaking. You’re not relinquishing control of your schedule; you’re relinquishing the need to spend half your life updating start and finish dates as tasks shift and change. And you have a schedule that stays relevant because it keeps up with the pace of the work.
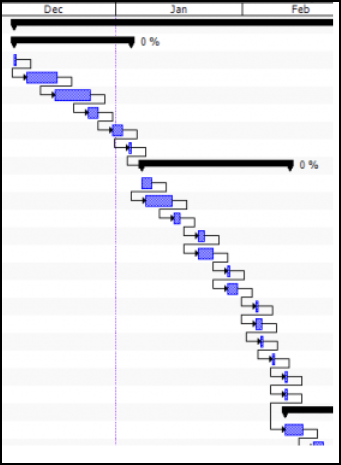
3. No web of dependencies
Dependency management alone can be enough to make schedule management a full-time job; get just one wrong and your schedule could be seriously screwed. All those links can make your Gantt chart look awfully messy too:
LiquidPlanner uses “always-on” automatic resource leveling so there’s no need to set up manual dependencies between tasks assigned to the same team member; instead, tasks will be scheduled one after the other based on their priority order in the workflow. If you do need to set up a dependency for other reasons, these are indicated by blue dots after the task. Click on these dependencies and you get a popup showing the dependent task and a link that will jump you to it.
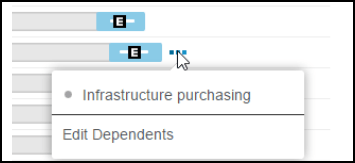
The good news here is that there’s no risk of double-booking a team member and no cobweb of lines across your planning work of art.
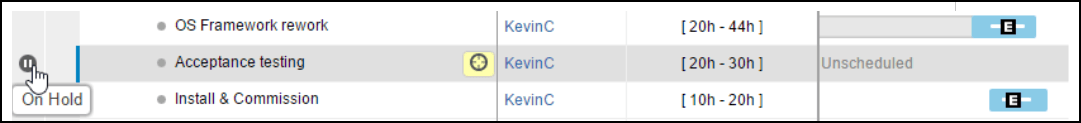
4. Schedule placeholders, streamlined view
One of the trickiest planning exercises at a project’s outset is deciding the who’s doing what. Often it will be impractical to craft a fully resource leveled plan for the project’s duration. Often it will be unnecessary. For example, if you’re just about to kick off Sprint 1, do you really need to establish who’ll be implementing which feature in Sprint 10? You probably don’t know which features you’ll even be building that far down the road.
If that’s the case, you can include tasks in your plan and keep them unassigned, so they’ll show as “Unscheduled.”
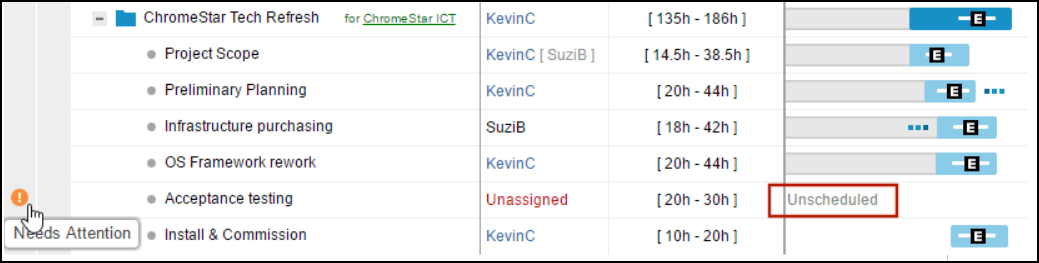
You won’t have a schedule bar for something that you have no idea about when or if will happen. Another tactic you can use is to put these tasks “On Hold” or stash them in a Backlog Package until you’re ready to get busy planning and working on them. Whichever mode you choose, you won’t busy up your Gantt view until you’re ready to go.
LiquidPlanner breathes new life into the Gantt chart in a dynamic and practical fashion. This approach allows you to focus fully on what’s left on your plate, i.e., the real work left to do and when it can realistically be done. You can get your schedule bar view, always updated, without the need to spend hours maintaining the plan. Whether you’re Waterfall, Agile, Agifall or some new yet unnamed method, LiquidPlanner will keep up with you and your team without breaking a sweat.
Learn more about Reading the LiquidPlanner Schedule Bars and their home base, the Timeline View in the LiquidPlanner support center.
Our smart schedule bars provide the most reliable and realistic Gantt chart experience you’ll ever have. How do we do it? Find out by downloading our eBook, “Introduction to Dynamic Project Management.”