
In today’s business world, everyone wants data. Which is why project metrics and analytics are such key components of LiquidPlanner. When you diligently enter project and task information into your workspace (estimates, time tracked, etc.), you’re automatically racking up precious project data—the kind that helps make meaningful business decisions, keep stakeholders in the loop, and track projects as they unfold.
As a Customer Success Manager, I talk to a lot of customers who ask how to surface key project metrics. They want to know the best way to share specific project information. Very often, the guidance I provide has to do with setting up a Dashboard.
The Beauty of Dashboards
LiquidPlanner Dashboards allow you to pull together stats and data from across your LiquidPlanner workspace into a centralized location. You can customize a dashboard to track project completion, provide status updates, or manage your work. You can keep everyone in sync by sharing dashboards with workspace members, as well as external stakeholders.
Using Pre-Built Dashboards
I’m happy to say that setting up a dashboard is easier now than ever before, thanks to Pre-Built Dashboards. There are three options to choose from: Project, Portfolio, and Team dashboards. These are great because as soon as you click save, there’s content already in place. You don’t have to stare at a blank page, trying to decide which widgets and filters to use.
Let’s explore one of these Pre-Built Dashboards. I’m a big fan of the Team Dashboard, so we’ll take a look at that one. And, with a nod to our national pastime, I’ll use baseball as my analogy.
The Team Dashboard as Seen Through Baseball
Baseball is all about stats—batting averages, RBIs, wins, strikeouts, and saves. Your LiquidPlanner workspace is full of stats too: hours logged, hours remaining, expected finish dates, and items at risk. In the project management game—hits, misses, and home runs—plays out on the projects tab instead of the diamond. Rather than “fielding” and “at-bats,” you’re adding projects, updating tasks, changing priorities and managing risk.
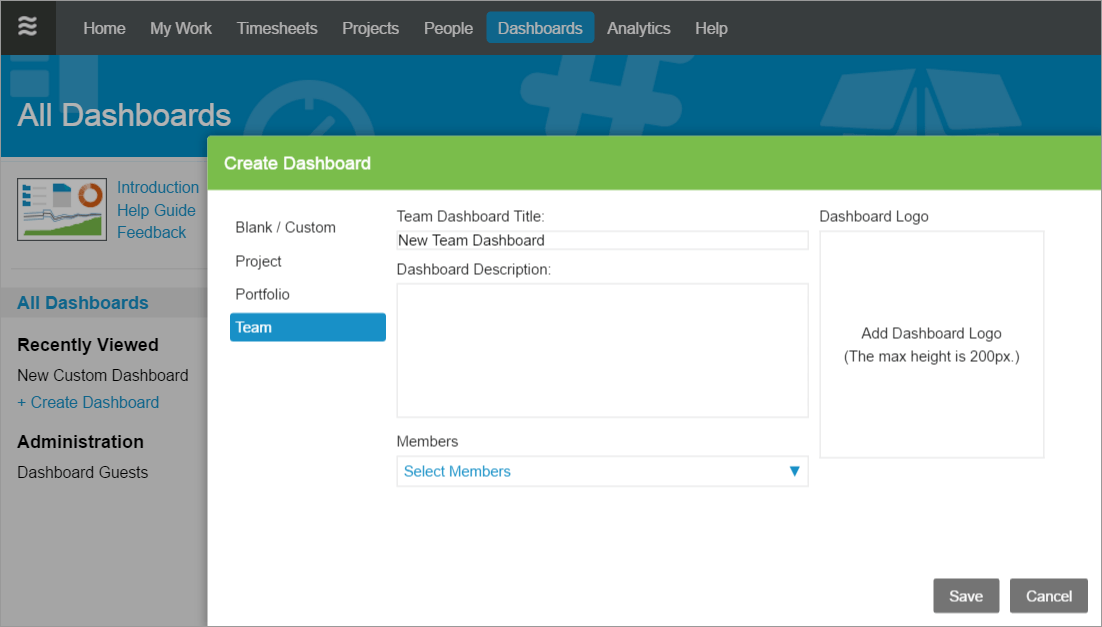
When you need to check out team standings, there’s no better place to look than a Team Dashboard. This pre-built dashboard uses a Person filter which automatically filters content to the team or members you specify when setting it up. Navigate to the Dashboards tab, click the Create Dashboard link, and select Team. Give your dashboard a name, fill in the description, and pick your players.
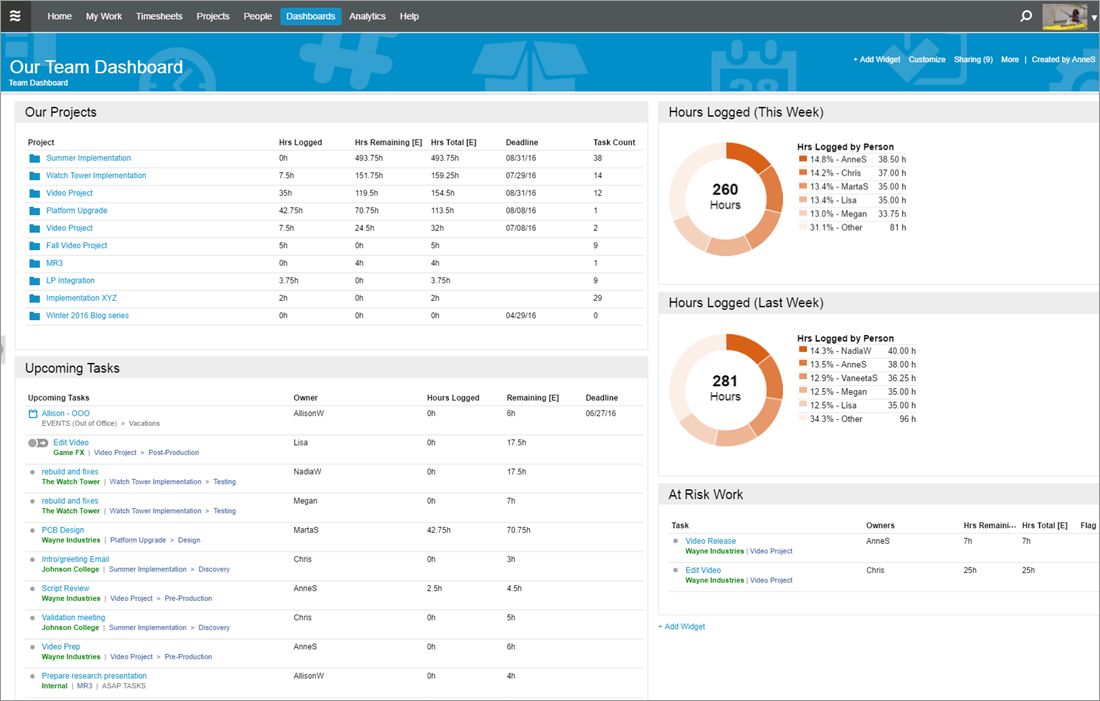
There are five widgets on this dashboard. It’s a solid leadoff, and you can improve the lineup by customizing the existing widgets or adding more of them.
- “Our Projects” is an analytics table widget that displays projects where your team has work assigned, and the number of tasks they own in each of those projects. A column to consider adding here is “Overall % Complete.” Or, if your workspace is one that identifies project phases using a custom project field, add that column instead, so you know just where you stand with each project.
- “Upcoming Tasks” is very much like the My Work tab; but instead of focusing on just one member, it includes the tasks, checklist items, events, and milestones assigned to all the members you’ve included in your team dashboard.
- There are two donut widgets on this dashboard, and they’re both set up to show logged progress. One for this week’s hours, and one for last week’s. It’s important to remember that logging progress keeps the plan updated, so encourage your team to knock it out of the park.
- Of course, it’s not all hits and runs in baseball. There are plenty of errors too. On this dashboard, “At Risk Work” shows exactly where you need to improve. (It’s an analytics table widget filtered to items flagged with an alert.)
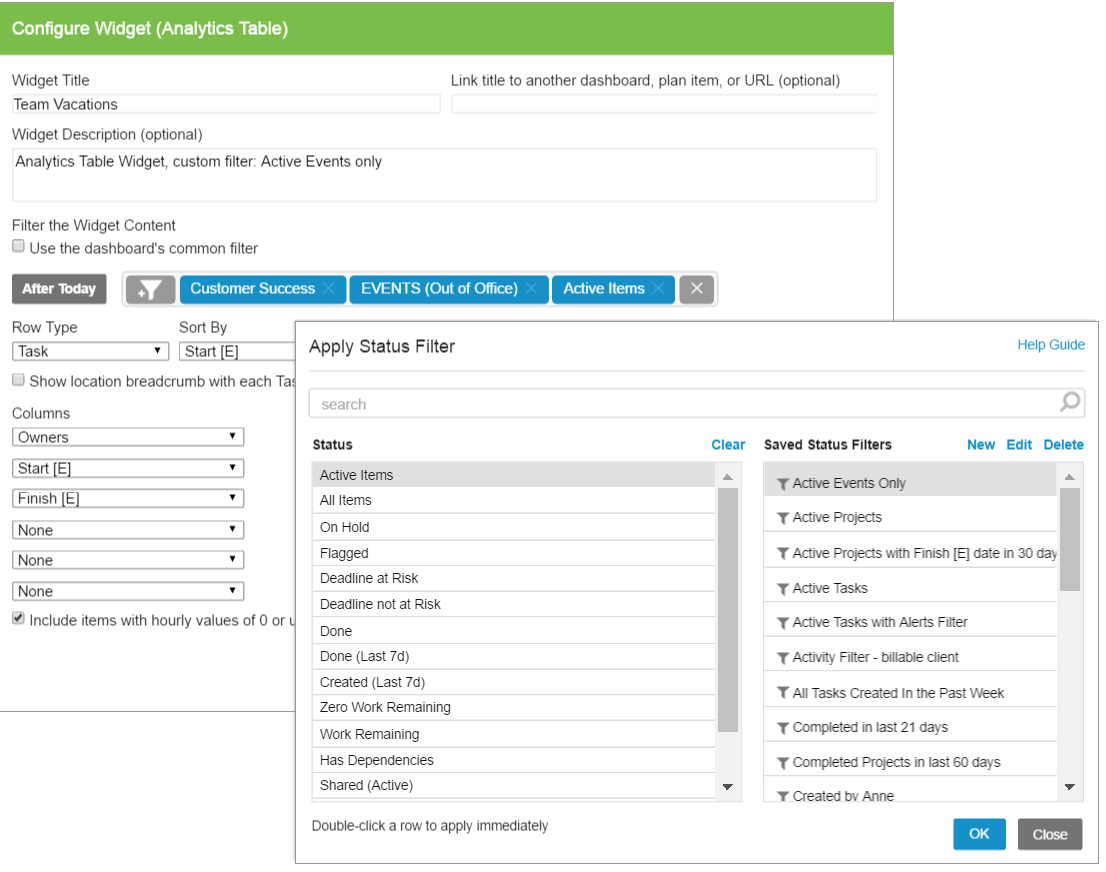
Make your team dashboard a true all-star by adding an analytics table widget to track upcoming vacations and company holidays.
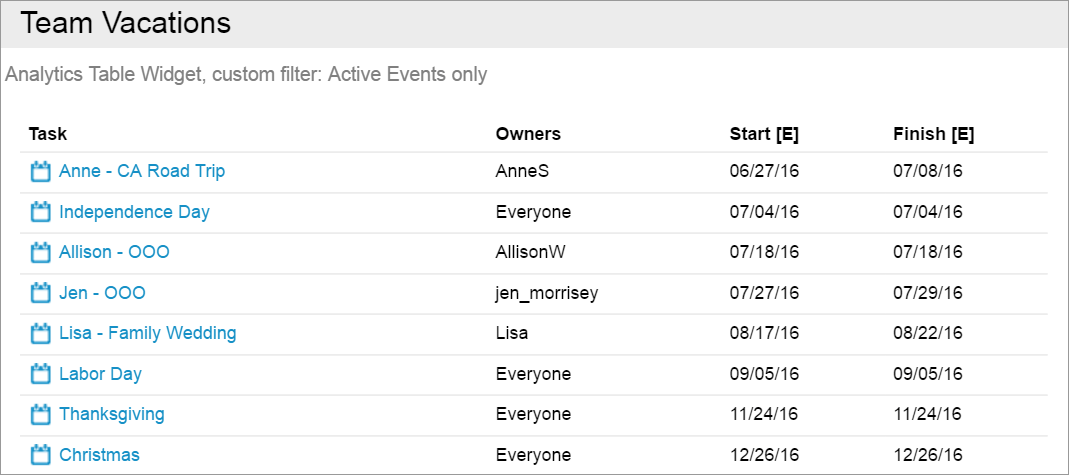
This widget uses a custom status filter with the rules “done is false” and “item type is Event.” Create the filter first, then add it to the widget by clicking on the “Active Items” task status filter. When Apply Status Filter opens, find your custom events filter under Saved Status Filters.
For a more detailed look at creating and customizing dashboards, grab some peanuts and crackerjacks, then settle in to watch our updated Dashboards video. Play ball!
One of the best ways to keep your data-rich LiquidPlanner workspace up to date is to keep estimating work items. Learn more about the art of estimation with our eBook 6 Best Practices for Accurate Project Estimates.