Say hello to the new Tempo! LiquidPlanner is now Portfolio Manager.
When meetings are organized and run smoothly, everyone attending is a happy camper. But there are times when meetings are disorganized, and attendees walk away feeling even less informed and become less productive. LiquidPlanner can help change that—try using a Dashboard to organize and run your next meeting.
Dashboards are a great way to surface important information in a clear and concise way. There are multiple types of widgets you can use to create a Dashboard; these widgets provide a variety of insightful data that will show a project’s progress and status.
Let’s review some of the different types of widgets you can use when creating a Dashboard. Additionally, we’ll provide a few examples of the information you can surface in order to boost productivity in your next meeting.
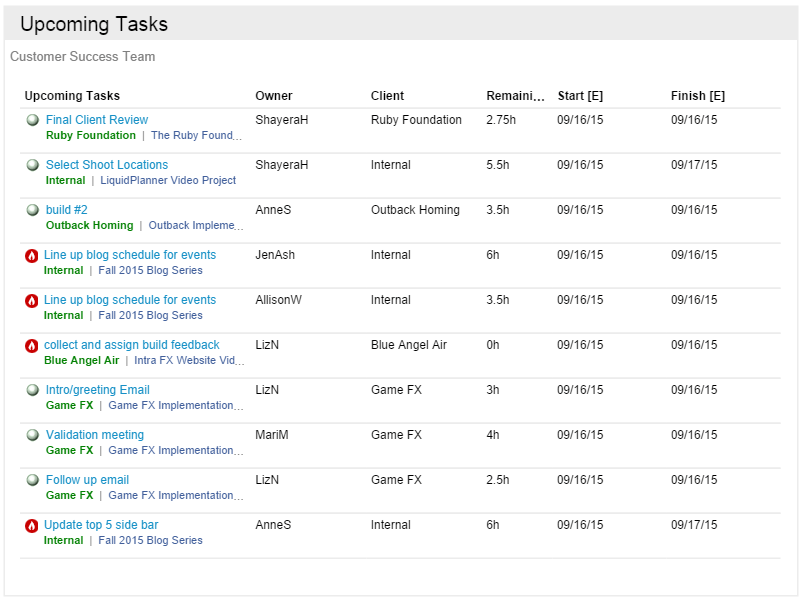
Upcoming Tasks
It’s always a good idea to discuss near-term work to make sure everyone is on track, and that projects will be completed on time. The Upcoming Tasks widget lets you provide a view of upcoming tasks by person or by team.
You can also customize the type of information displayed by selecting different columns—such as providing the name of the Client that the task is associated with, the remaining effort, expected start and expected finish dates. If any tasks are at risk, that will be shown as well by the fire icon.
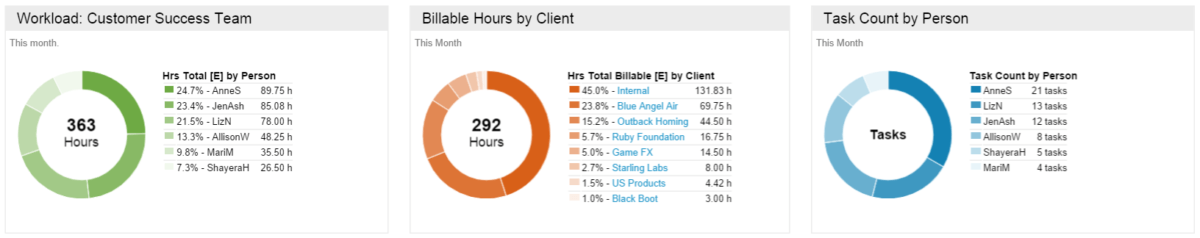
Donut Charts
The Donut Chart widget is perfect for providing a visual of hourly metrics, such as the total number of hours expected or remaining, hours logged, task count, etc. You’ll be able to select a specific focus for the Ring Emphasis on the chart as well—which can be Person, Task, Activity, or Status.
If you’re looking to gain insight into workload, provide a visual for the team with the amount of billable hours spent per client, or the task count, for example.
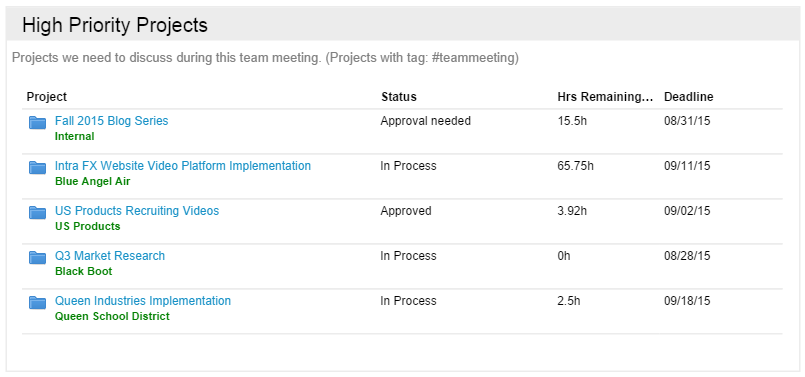
Analytics Tables
The Analytics Table widget allows you to pull real-time data on the progress (logged hours and scheduled hours) of your projects, tasks, team, client, etc.
If you’re planning to discuss specific projects or tasks in your meeting, an easy way to surface specific items is to use Tags. Simply add a tag like #teammeeting on the plan items that you plan to cover, and when you create the Analytics Table widget, you’ll be able to Filter by Tag to surface those items in the widget. This will provide a clean and clear view of which items you absolutely need to discuss in the meeting. Once the meeting is over, you’ll be able to easily remove the tag from the item.
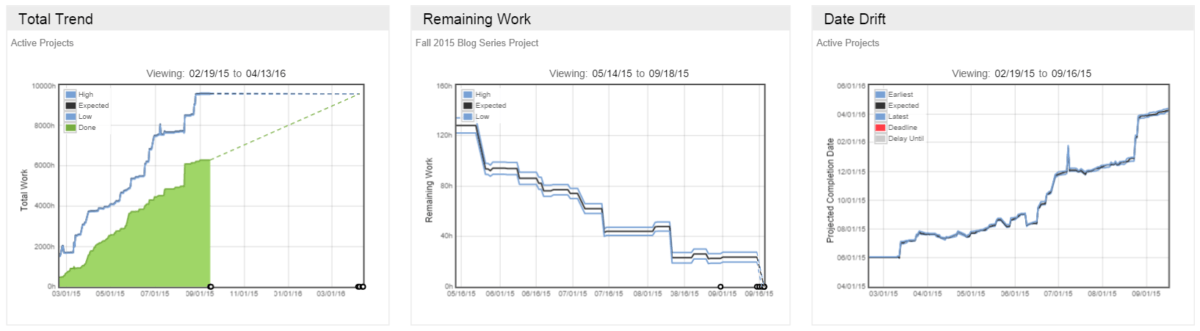
Trend Charts
The Trend Chart widget allows you to display the Total Trend, Remaining Work or Date Drift for specific items in your plan. These graphs provide high-level views of the changes in the total amount of work, the estimated remaining effort, or the finish date over time for a specific package, project or task.
When you combine these different types of widgets together into one Dashboard, you’ll be able to get a really impactful view of your data. Check out our Dashboard Gallery to see some examples of the different types of Dashboards you can create.
Feeling inspired?
If you haven’t already, create your own dashboard now. Visit our Dashboards help guide article for more helpful information on how you can create, customize and share your dashboard.