Project Dashboards can be accessed from within a Project or through the Dashboard Library. To access from a Project, go to Projects in the left-side navigation, select a Project and open its Dashboard. To access via the Dashboard Library go to Dashboards in the left-side navigation. Project Dashboards can be created in any Collection: SCHEDULED, PENDING, ARCHIVED and TEMPLATES.
| 1 |
Every Project has a Dashboard # |
A Project Dashboard springs to life with sample Widgets and Groups the very first time a Project Manager accesses it. After that, they can customize it in Design Mode. Everyone with access to the Project sees the same widgets and data.
This lesson covers Project Dashboards which capture data from a single project. Use Workspace and Package Dashboards to monitor work across multiple projects.
See the Dashboards lesson to learn about components that are common across all Dashboards: View Mode, Design Mode, Layout, Widgets, Widget Groups, Settings, Scope and Filtering. The Widgets & Groups lesson can help you decide how to display your Project data.
Other lessons in the Dashboards Course are: Dashboards Library, Workspace Dashboards, Package Dashboards.
| 2 |
Project Dashboard Scope & Filtering # |
Scope sets the Dashboard’s boundaries. In a Project Dashboard, scope is the Project and all the data in the dashboard comes from Members, Resources, Schedule Data, Work and Properties within the Project. Project Dashboard scope can’t be edited, but Groups and Widgets can be scoped to Sub-Folders within the Project.
![]() Scope needs attention displays when Groups or Widgets are accidentally scoped outside the Project. If you see this warning, examine the Group and Widget Scope in Design Mode to correct the issue.
Scope needs attention displays when Groups or Widgets are accidentally scoped outside the Project. If you see this warning, examine the Group and Widget Scope in Design Mode to correct the issue.
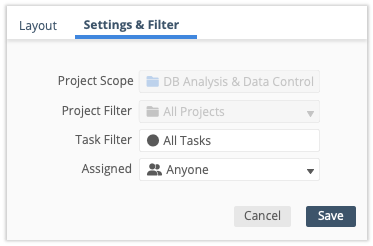
Filtering occurs within the Dashboard Scope. Setting Dashboard Filters is optional. Groups and Widgets inherit the Dashboard Scope and Filters.
Scope and Filtering are located under Settings & Filter in Design Mode.
| 3 |
Sample Groups & Widgets on the Project Dashboard # |
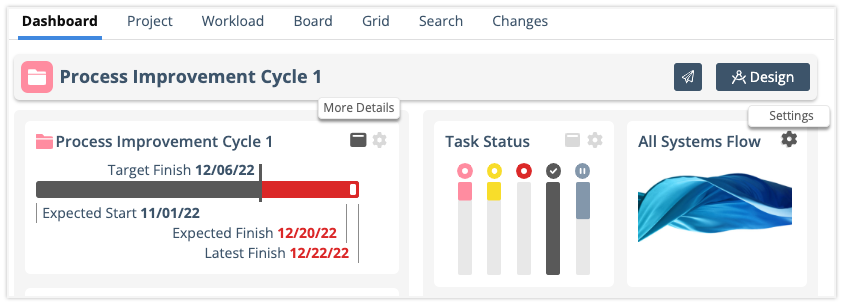
A Project Dashboard starts out with eleven Widgets in two Groups. Eight widget types are represented: Schedule Summary, Task Board, Image, Workload, Properties Summary, Metrics Tally, Task List, Changes.
Clicking More Details on the Widget performs the action defined in its Settings. It can expand into a View on the Dashboard, open a Plan Item Edit Panel or navigate to another View in the Workspace.
Project Managers can use Settings to edit widgets without leaving View Mode. For more extensive customization, go into Design Mode. Here are some things to try:
Scope Groups or Widgets to Project Sub-Folders.
Apply Filters to Groups, and to the Widgets that have Data Filter Settings.
Change what happens when More Details is clicked on Widgets that have On-Click Settings.
Adjust the Layout by dragging Widgets and Groups to new locations on the Dashboard.
Add more Widgets and Groups or Duplicate existing ones and change the scope and filters.
Read about the settings on sample Widgets and Groups in the Project Dashboard. . .
All the sample Widgets and Groups inherit the Dashboard Scope which is the Project. On the left side of the Dashboard, Group One has five sample Widgets. Group Two on the right side has six sample Widgets.
Each of the Groups are using the default filters: All Projects, All Tasks, Assigned to Anyone. The tables below show the widgets in each group, what they display on the Dashboard in View Mode, what happens when More Details is clicked and the Widget filters.
| Group One Widgets | Display in View Mode | More Details | Filters |
| Schedule Summary | Project Schedule | On-Click = Schedule View navigates to Project View | All Projects, All Tasks, Assigned to Anyone |
| Workload | Top 5 Project Workload | Workload View expands on the Dashboard | All Projects, All Tasks, Assigned to Anyone |
| Properties Summary | Package (location), Project (name), Created by, Created on, Project Status (Active, On Hold or Done) | On-Click = Panel > Properties opens Project Edit Panel Properties tab | All Projects, All Tasks, Assigned to Anyone |
| Metrics Tally | Total Work [E], Hours Logged, Remaining Estimate [E], % Complete, Uncertain Hours | Metrics Tally View listing all Project Metrics | All Projects, All Tasks, Assigned to Anyone |
| Changes | 5 most recent Project Changes | Changes View on the Dashboard with Project changes over the last 90 days (30 on the FREE Plan) | All Projects, All Tasks, Assigned to Anyone |
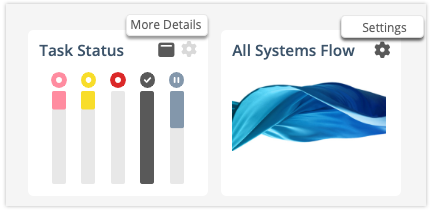
Group Two has a Task Board, an Image and four Task List widgets. Settings for the first two widgets are in the next table.
| Group Two Widgets | Display in View Mode | More Details | Filters |
| Task Board | Custom Task Status Meter | Board View on the Dashboard | All Projects, All Tasks, Assigned to Anyone |
| Image | Open settings to add an image | None | All Projects, All Tasks, Assigned to Anyone |
The Task Lists in Group Two display 3 columns and up to 15 rows. Clicking on a widget opens Grid View in the Dashboard. Row Click in the widget opens the Task Edit Panel Assignments tab. Each of these widgets has a Task Filter applied.
| Task List Widget Name | Column Display in View Mode | Sort By | Task Filter |
| ASAP Tasks | Expected Finish, Assigned To, % Complete | Expected Finish (ascending order) | Custom: Active Tasks and ASAP |
| Active Tasks by Expected Finish | Expected Finish, Assigned To, % Complete | Expected Finish (ascending order) | Active Tasks |
| On Hold Tasks | Assigned To, Logged, % Complete | Default (priority list order) | On Hold |
| Recently Done Tasks | Done Date, Logged, Unused Hours | Done Date (ascending order) | Done Tasks |
| 4 |
Filtering Groups and Widgets on the Project Dashboard # |
Filtering uses AND logic to identify items that meet all the Scope and Filter criteria. Due to a Project Dashboard’s limited scope, it may be best to keep the Project Dashboard default filters in place and use Scope and Filtering on Groups and Widgets to hone in on project data.
Group Filters are set in Design Mode. Use the filter icon in the Group header to open the filter modal.
Use Settings on a Widget to access it’s filters from either View Mode or Design Mode.
List Widgets, Metrics Tally, Task Board and Workload widgets have Data Filter Settings. Learn more in the Widgets & Groups lesson.
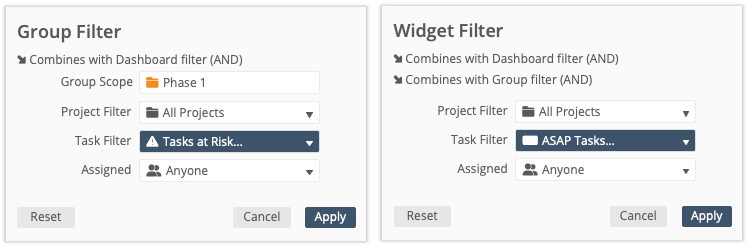
Read more see an example of Group and Widget filtering…
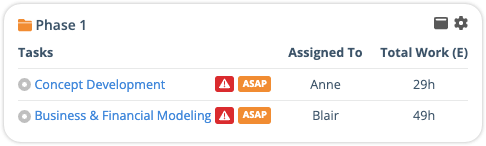
In the example above, a Group is Scoped to the Phase 1 Sub-Folder and filtered to Tasks at Risk. A Task List widget in the group is filtered to ASAP Tasks, resulting in a list of Tasks in the Phase 1 Sub-Folder that are at Risk and have priority overrides- ASAP in the Project, ASAP in the Package, ASAP in the Workspace.


