On-time, every time: Supercharge your project delivery with the Portfolio Manager + Jira integration
 Table Reports are similar to Grid Views – but they have a distinct advantage because a Table Report can be saved to keep settings, columns and filters intact. There are People, Package, Project, Sub-Folder, Task and Assignment Table Reports. They are available in all Libraries, alongside Dashboards. Table Reports can be downloaded to excel or shared with other members by copying a link. Access controls ensure they can only be viewed by members who have access to plan items in the report.
| 1 |
Table Reports in all Collections and Libraries # |

Table Reports are available in all Collections and Libraries. Access Workspace reports by going to Library in the left-side navigation. Click on a report name in the Library to open an existing report or use the 3-dot menu and choose from the options there. Click the star to Favorite a report and display it in the left side navigation for easy access.
Workspace Library and Portfolio Library have People, Package, Project, Sub-Folder, Task and Assignment Table Reports.
Package Library has People, Project, Sub-Folder, Task and Assignment Table Reports.
Project Library has People, Sub-Folder, Task and Assignment Table Reports.
Use +Reports to create a report.
Read more to learn about creating a report. . .
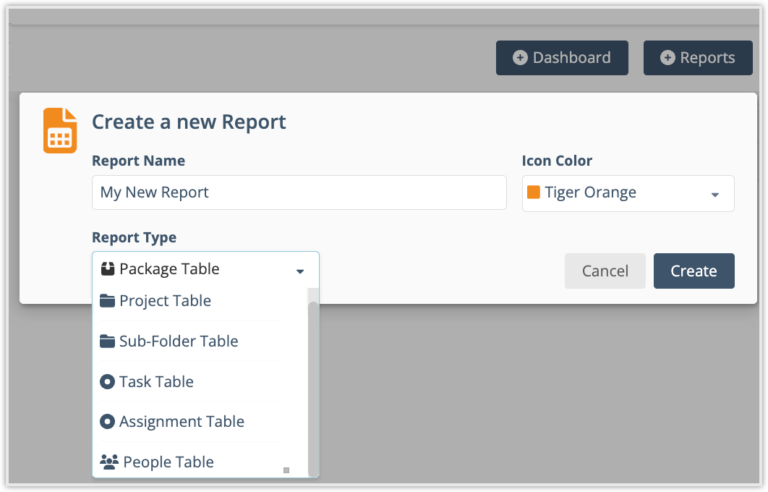
+Reports opens the report menu. Enter a name, choose a color, and then select a report type from the menu. Create initiates the report. After landing in the report view, use the Design button to access design mode where you can customize columns and filters.
| 2 |
Table Report # |
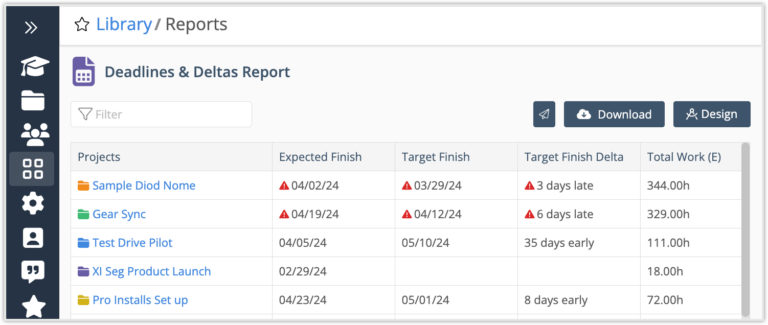
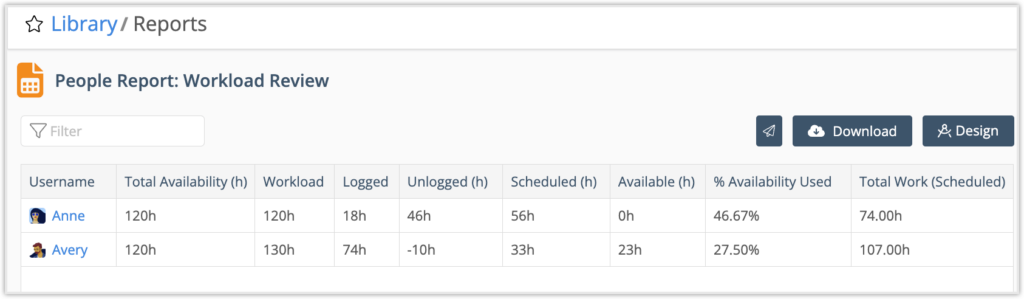
Each row in a Table Report shows a roll up of hours and work metrics based on the report location.
Once the report is created it’s location scope, filters, columns, and sort order can be customized. Click the Design button to access design mode.
Download the report to Excel for further analysis or use the copy link button to share it with other workspace members.
| 3 |
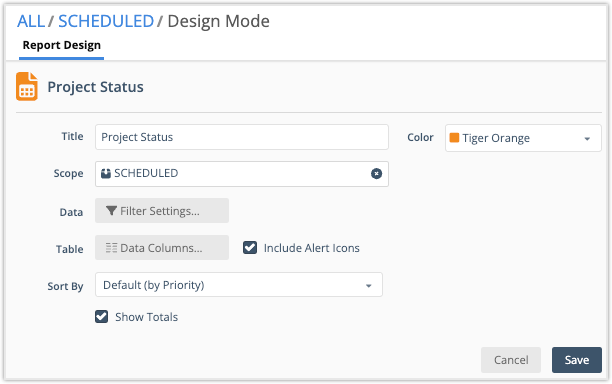
Customize in Design Mode # |
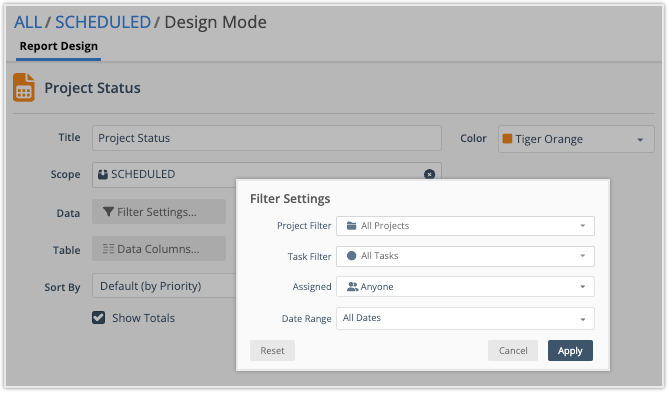
The report’s location is it’s default Scope. A report can be scoped to items within a location, for example, a Collection within the Workspace, a Project within a Package, or a Sub-Folder within a Project.
Filter Settings
Default Filter Settings for Project and Task Status Filters are All Projects and All Tasks. Use the Custom Filter option in the drop down to filter by item properties and custom data fields.
Project Status Filters: All Projects, Active + On Hold, Active, On Hold, Done, Projects at Risk, Custom Filter
Tast Status Filters: All Tasks, Active + On Hold, Active, On Hold, Done, Tasks at Risk, Custom Filter
Use Assigned to filter by Member, Resource, Placeholder or Group. Disconnected Members, Deactivated Resources, and Placeholders appear in red.
Date Range
All Dates shows the current state, with a complete roll up of items within the report or widget scope. When a date range is applied, the filtered state changes to include only those items or people with hours logged or scheduled in the selected time period. Learn more in the lesson about the Date Range Filter.
| 4 |
Columns, metrics, and rollups # |
Report and List Widget columns fall into categories: Counts, Work Metrics, Custom Data, Dates, Reference, Date Range and Utilization. Columns are “Filter Aware,” to ensure that totals and counts adjust based on the filters applied. Some metrics are displayed as a rollup from aggregated data (such as hours logged or remaining) while others are directly associated with items or people defined in the report.
Columns associated directly with the item:
Location, File Count, Created by, Created on, Description, LP ID, Updated at, Updated by
Target Dates and Target Date Deltas
Benchmark Estimate, Work Limit and Work Limit Delta
Metrics that roll up from aggregated data include:
% Complete, Item Counts, Calculated Dates, Work Metrics
Most columns in a People Table relate directly to the Member, Resource or Placeholder.
Read more to learn about columns in a People Table Report. . .
Profile Columns: Username, First Name, Last Name, Groups, User Status, User Type, Custom Data Fields
Work Metric Columns: Logged, Uncertain Hours, Unused Hours
Item Count Columns: Project Count, Task Count, Assignment Count
Utilization Columns: these require a date range to calculate results, without a date range they display N/A.
Total Availability (h): number of hours someone is available during a time period. Availability is reduced when they have time off.
Workload: when Workload is higher than Total Availability it means they tracked more time than their available hours in a time period. This metric has four components:
Logged (h) + Unlogged (h) + Scheduled (h) + Available (h)
Logged (h): time tracked during the time period (usually in the past).
Unlogged (h): a positive number represents hours someone was available but they didn’t track time. Negative indicates more hours were logged than available, contributing to Workload being out of balance with Total Availability.
Scheduled (h): hours scheduled during the time period (always in the future).
Available (h): hours someone is available during the time period but they don’t have anything scheduled (they could take on work).
% Availability Used: percentage of total availability that’s scheduled during the time period for work in the report location (workspace, package or project).
Total Work Scheduled: hours scheduled during the time period + hours logged during the time period.
| 5 |
Total Row # |
The Total Row makes it easy to view a summary of your data and saves the effort of creating downloads that have to be manipulated and shared outside the workspace. To show totals in your report, use the Design button to access the Report Design view and check the box to Show Totals.
The Total Row adds up counts, hours, numeric and currency fields, displaying totals for each column at the bottom of the report. Percentage totals are calculated (not summed).
Numeric and Currency Custom Data fields have a setting that controls whether or not totals are calculated in reports and list widgets. Workspace Managers and Org Admins can turn totals on for these data fields by going to Custom Data Fields under Administration in the left-side navigation.
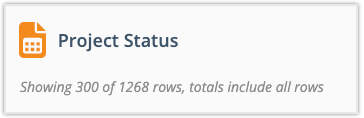
When the total row is shown helper text at the top of the report shows the number of rows being displayed. The display limit for a report is 300 rows. Totals are calculated from all report rows, including those that are beyond the display limit. Download the report to view all rows.